

“Over the years we’ve invested significantly in our field data team - focusing on producing trusted ratings. While this ensures the accuracy of our Ratings, it doesn’t allow the scale across the thousands of projects that buyers are considering.”

For more information on carbon credit procurement trends, read our "Key Takeaways for 2025" article. We share five, data-backed tips to improve your procurement strategy.
One more thing: Connect to Supply customers also get access to the rest of Sylvera's tools. That means you can easily see project ratings and evaluate an individual project's strengths, procure quality carbon credits, and even monitor project activity (particularly if you’ve invested at the pre-issuance stage.)
Book a free demo of Sylvera to see our platform's procurement and reporting features in action.
Bridging the gap: why superpollutant credits are becoming essential to carbon portfolios
Over the past year, the term superpollutants has become commonplace across the carbon markets. Registry Isometric announced its expansion into superpollutant credits in October 2025. The Climate and Clean Air Coalition (CCAC) launched the Superpollutant Country Action Accelerator at COP30 in November 2025. And at Sylvera, we released our first superpollutants framework, covering landfill methane (LFM) projects, in December 2025.
So why are superpollutants suddenly a hot commodity?
In this article, we explain what superpollutants are and what credit types exist, why they are entering corporate portfolios now, what the market data actually shows about issuance and retirement, what the segment’s integrity history means for buyers today, and how to tell a high-integrity superpollutant project from a questionable one.
What is a superpollutant?
Superpollutants are gases with a greater warming impact per tonne than carbon dioxide. Collectively they are estimated to have driven around 54% of historic global warming, and atmospheric methane – the most prevalent superpollutant – has risen 156% since 1750 (IPCC AR6).
They fall into five groups:
- Methane (CH₄)
- Tropospheric ozone precursors, including carbon monoxide, hydrogen, and volatile organic compounds
- Hydrofluorocarbons (HFCs) and other fluorinated gases (F-gases)
- Nitrous oxide (N₂O)
- Black carbon (BC)
How much each one matters depends on two things: which wavelengths of light the molecule absorbs, and how long it survives in the atmosphere. Together these determine its global warming potential (GWP) – its warming impact relative to CO₂ over a defined period.
In its sixth assessment report, the IPCC put methane at roughly 30 times more potent than CO₂ over 100 years, N₂O at 273 times, and the F-gas nitrogen trifluoride at 17,400 times.
Methane
Methane accounts for around 29% of historic warming (CCAC). It leaves the atmosphere far faster than CO₂, but that short lifespan comes with a trade-off: its warming impact is concentrated into the near term. Measured over 20 years rather than 100, methane’s GWP rises sharply – which is precisely why methane abatement is attractive to anyone focused on the next two decades of warming. Its major sources are animal agriculture, oil and gas operations, landfills, and rice cultivation.
Tropospheric ozone precursors
Tropospheric ozone, together with the carbon monoxide and non-methane volatile organic compounds that help form it, accounts for around 10% of historic warming (CCAC). Unlike methane or CO₂ it isn’t emitted directly – it forms when precursor gases react in sunlight. Major sources are fossil fuel combustion in transport and industry, agricultural and biomass burning, and residential cooking with solid fuels.
Nitrous oxide, F-gases, and black carbon
N₂O has contributed around 5% of global warming, driven mainly by synthetic fertilizer use and manure management, at 273 times the warming impact of CO₂ per tonne (CCAC Global Nitrous Oxide Assessment).
F-gases – chiefly the HFCs used in refrigeration and air conditioning – and black carbon, the soot released by incomplete combustion, contribute 5% and 3% respectively. The most abundant HFC warms the planet nearly 3,800 times more than CO₂ over 20 years (CCAC – HFCs), while black carbon can warm up to 1,500 times more than CO₂ per unit of mass despite surviving in the atmosphere for only days (CCAC – Black Carbon).
What types of superpollutant credits exist?
Superpollutants don’t map neatly onto credit categories. The market groups projects by the activity that reduces emissions rather than by the gas involved, so some categories overlap and some superpollutants have no dedicated project type at all. That matters commercially: availability, methodological maturity, and price vary enormously across these categories, and two projects addressing the same gas can look completely different from a diligence perspective.
Methane (CH₄) credit types
Landfill methane (LFM), biogas
Coal mine methane
Oil and gas fugitive emissions, orphan well plugging
Agriculture and livestock
Rice methane, alternate wetting and drying (AWD)
HFCs, nitrous oxide (N₂O), other F-gases credit types
Industrial gas destruction and substitution projects
ODS – ozone-depleting substances, refrigerants and foam-blowing agents
N₂O credits – fertilizer and agriculture
Tropospheric ozone precursors, black carbon
No active project types
Why superpollutants are entering portfolios now
The short answer is that carbon removal isn’t scaling fast enough, and superpollutant abatement buys time.
Carbon dioxide removal (CDR) actively takes CO₂ out of the atmosphere, as opposed to abatement, which prevents emissions in the first place. CDR splits into shorter-duration natural removals such as soil and forest carbon, and durable technology-based removals such as direct air capture and biochar.
The scaling problem is stark. The CDR market grew by around 2% between 2025 and 2026. Meeting IPCC-aligned pathways requires 6–10 gigatonnes of removal per year by 2050, against roughly 8 megatonnes today – a gap that implies compound growth closer to 30% a year, sustained for decades. Keeping warming within 2°C also requires net negative removals of around 30 gigatonnes by 2100 (IPCC AR6 WGIII SPM).
Market confidence took a further knock in April 2026, when Microsoft paused its durable CDR purchases. Microsoft has since resumed buying, but the episode underlined how thin the demand base still is, and how far the sector remains from Paris-aligned trajectories.
This is where superpollutants come in. Because gases like methane are both highly potent and short-lived, cutting them delivers warming reduction on a timescale that matters now, rather than over the century-long horizon on which CO₂ removal operates.
The result is that superpollutant credits are increasingly used as a near-term complement to removals rather than a replacement for them – delivering measurable impact in this decade while durable CDR capacity is built. Registries and developers have noticed, and supply is responding accordingly.
An important caveat: these are avoidance credits
Almost all superpollutant credits are avoidance or reduction credits, not removals. They prevent emissions rather than drawing existing greenhouse gases out of the atmosphere.
This matters for how they can be claimed. Guidance including SBTi’s treats avoidance and removals differently, and a net-zero commitment generally requires durable removals to neutralize residual emissions. Superpollutant credits are therefore best understood as a complement within a diversified portfolio – strong near-term impact per dollar, alongside the removals a net-zero claim ultimately depends on. Buyers substituting one for the other should check that their claims framework supports it.
Superpollutants by numbers
Superpollutant credits are now a significant category within the carbon market, and 2025 delivered the clearest evidence yet of demand picking up. Retirements jumped to 26.2 million, the highest in the eight-year window and close to double the 2024 figure.
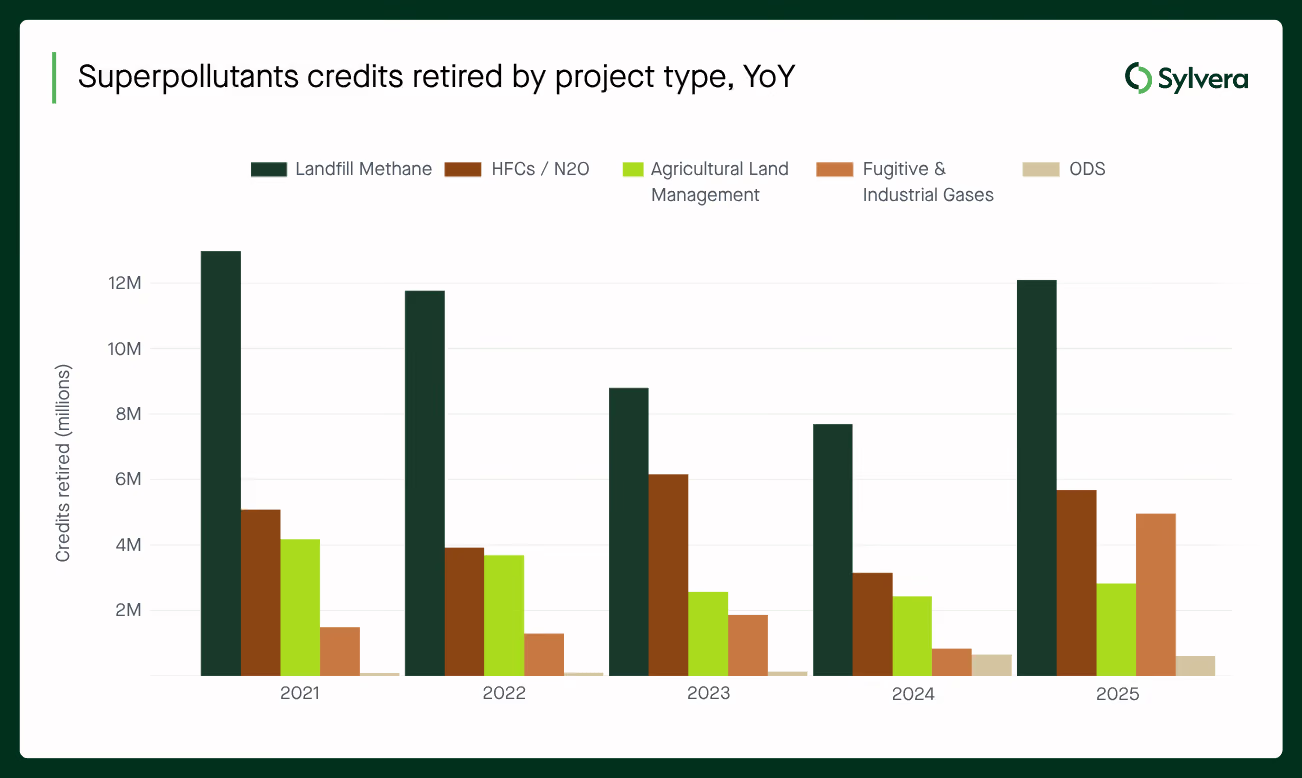
Landfill methane dominates on volume, accounting consistently for 16–23 million issuances a year and leading the 2025 retirement increase of +4.5 million from 2024. HFC and N₂O issuance has nearly doubled since 2021, from 6.6 million to 10.6 million. Coal mine methane and oil and gas fugitive-emissions retirements rose roughly fivefold in 2025, from 0.8 million to 5.0 million. ODS remains the smallest category by volume but has nearly tripled issuance since 2021.
Where the projects are
Landfill methane is the most geographically distributed type, with more than 25 contributing countries. The US (87 million credits) and Brazil (81 million credits) lead, followed by China, Turkey, and Chile.
HFC and N₂O projects are far more concentrated. China alone accounts for 501 million credits, over half of global issuance; with South Korea and India, the top three countries represent roughly 80% of issuances. For coal mine methane and oil and gas fugitives, Bangladesh (30 million) and Uzbekistan (25 million) lead. In ODS, the US supplies 93% of global volume, at 34.5 million of 37 million.
Who is buying
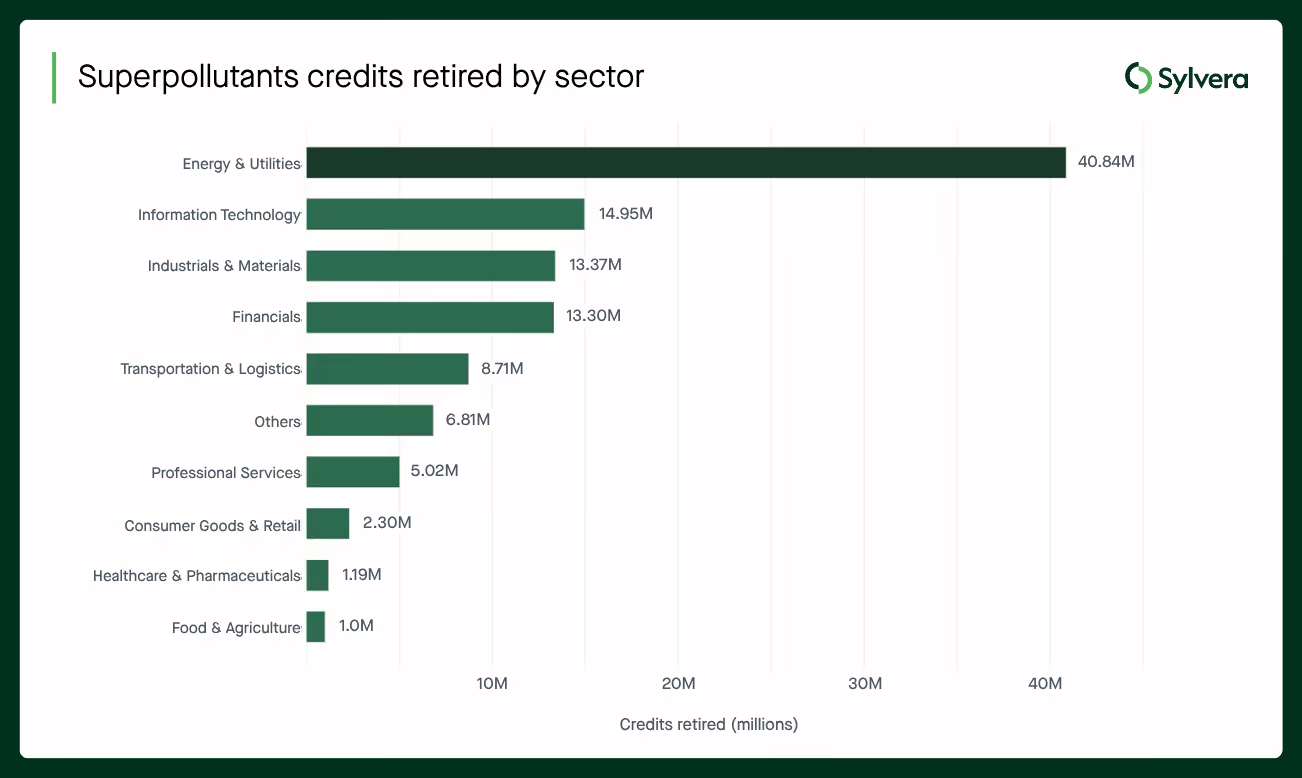
Energy and utilities firms lead overall, retiring 40.8 million credits – nearly three times the next sector (Information Technology) – and dominating landfill methane specifically, consistent with their direct operational exposure to methane. Industrials and materials leads on HFC and N₂O retirements at 11.5 million, reflecting a concentration of chemical manufacturers and refrigerant producers.
What buyers should know about this segment’s integrity history
Superpollutant abatement is not new to carbon markets, and its track record includes some of the most instructive integrity failures the sector has produced. Any buyer entering this segment should understand that history, because it shapes what good diligence looks like today.
Industrial gas destruction and the perverse incentive problem
The best-known case involves HFC-23, a byproduct of HCFC-22 refrigerant manufacturing and an extremely potent greenhouse gas. Under the Clean Development Mechanism, destroying HFC-23 generated very large volumes of credits relative to the cost of destruction. The concern that followed was structural: the credit revenue was valuable enough that it could rationally incentivize producing more of the parent gas in order to generate more waste to destroy. Regulators acted – the EU ETS barred HFC-23 and adipic acid N₂O credits from 2013.
The lesson generalizes beyond HFCs. Wherever a credit rewards destroying a byproduct, the incentive structure of the underlying production process is part of the diligence question, not a background detail. For buyers looking at industrial gas destruction credits today, the questions are what has changed methodologically since, how the project handles the production-incentive risk, and whether the baseline reflects genuine business-as-usual.
Coal mine methane and the additionality question
Coal mine methane retirements grew roughly fivefold in 2025, which makes its additionality profile a live issue rather than a historical one. Methane capture at mines is sometimes already required by safety regulation, and captured gas can carry its own value as an energy product. Where either is true, the case that carbon finance caused the abatement becomes harder to make.
None of this makes coal mine methane credits inherently low quality – plenty of projects have a sound additionality case. But it does mean the regulatory and economic context of the specific mine matters more than the project category, and generic assurances are not enough.
Why this history is useful rather than disqualifying
Every one of these issues was ultimately identified through independent scrutiny of the underlying incentives and baselines – exactly the work an assessment layer exists to do. A young segment with thin methodological consensus is precisely where independent, consistent evaluation adds the most value. That is the frame for the section that follows.
The GWP timeframe question
One technical choice deserves particular attention in this segment, because it directly changes how many credits a project issues.
Global warming potential is always measured over a defined timeframe, and for short-lived gases the choice is consequential. Methane’s GWP over 20 years is roughly triple its GWP over 100 years, because its warming is concentrated in the near term. A project using a 20-year figure will therefore claim substantially more CO₂-equivalent reduction than the identical project using a 100-year figure.
Neither timeframe is wrong. GWP100 is the convention in most registries and national inventories; GWP20 arguably better reflects near-term warming, which is the whole reason superpollutants are strategically interesting. What matters is that buyers know which one a project used, that it is applied consistently, and that it aligns with how they intend to report the credits. Where a project selects a GWP value, that selection is part of the carbon accounting assessment – not a footnote.
What quality looks like in superpollutant credits
Superpollutant credits remain relatively novel, and established guidelines and methodologies are still thin on the ground. Projects model baselines differently, apply different GWP values, and monitor performance with widely varying rigor. So how does a buyer establish that a credit represents a real reduction?
Sylvera currently has three live superpollutant abatement frameworks: our landfill methane (LFM) framework, with 20+ full Ratings and over 300 Estimated Ratings published; and our newer Orphan Oil and Gas (OOG) Well Plugging and Alternate Wetting and Drying (AWD) frameworks.
Across all three, the same four pillars anchor the assessment – even though the underlying risks look very different from one project type to the next.
Carbon accounting
This asks whether a project’s claimed emission reductions survive independent recalculation.
For landfill methane, that means benchmarking reported baseline and flaring emissions against Sylvera’s own recreated equations. For orphaned wells, it means scrutinizing how the project models terminal decline rates and selects its GWP value, alongside the rigor of pre-plugging leak measurement and post-plugging verification. For AWD, it means testing the robustness of the digital MRV systems tracking water levels and methane at field level.
The underlying question never changes: is the claimed reduction accurate and conservative, or does it rest on unverifiable assumptions and generous defaults?
Additionality
This asks whether the reduction would have happened anyway – the question the integrity history above turns on.
Orphaned wells score well here. There is typically no solvent owner, and government plugging budgets are chronically underfunded, so carbon finance is often the only viable route to remediation. Landfill methane and AWD face different tests: is the practice already common in the region, is there a policy or regulatory mandate driving it, and would the activity be financially viable without carbon revenue?
The building blocks are consistent across every project type: financial necessity, common practice, and the policy environment.
Permanence
Permanence varies more than buyers coming from forestry might expect – and mostly in superpollutants’ favor.
Both LFM and AWD projects are avoidance-based. They don’t store carbon, so they aren’t exposed to reversal risk the way forestry or soil carbon projects are, which is a structural advantage in this pillar.
For orphaned wells, there’s the added dimension of interwell methane migration – the risk that gas simply finds a neighboring unplugged well to escape through, which we assess through geospatial well mapping of the surrounding area.
Safeguarding and co-benefits
The fourth pillar covers the beyond-carbon picture: community impact, biodiversity, and contribution to the UN Sustainable Development Goals.
AWD projects, working directly with smallholder farmers, tend to show a strong co-benefit profile – water savings, yield stability, and improved farmer income. Landfill and orphaned-well projects contribute more modestly, through air quality, local employment, and groundwater protection, reflecting the difference between industrial and agricultural interventions.
The four questions underneath the four pillars
The specific risks differ by project type. The questions to ask don’t:
- Was the reduction independently recalculated, or taken on trust?
- Would this reduction or avoidance have happened anyway?
- Is the reduction genuinely permanent, and what is the residual risk if not?
- Does the project do right by the people and ecosystems around it?
What developers need to evidence
For developers, the flip side of thin methodological consensus is that the burden of proof sits with you. Buyers entering this segment are aware of its history, and the projects that command confidence – and price – are the ones that anticipate the diligence rather than react to it.
In practice, that means being able to evidence four things:
- Recalculable numbers. Baseline and reduction calculations that a third party can reproduce from disclosed inputs, rather than asserted totals. Conservative parameter choices are worth more at the point of sale than optimistic ones, because they survive scrutiny.
- An explicit additionality case. Financial necessity, common practice in the region, and the regulatory position, documented rather than assumed. For project types where regulation may already mandate the activity, address it head-on.
- Transparent GWP and monitoring choices. State which GWP timeframe and assessment report you used and why, and be specific about monitoring frequency, instrumentation, and how gaps are handled.
- Quantified co-benefits. Particularly for agricultural project types, where water, yield, and income outcomes are measurable and increasingly influence buyer selection between otherwise comparable projects.
An independent rating gives buyers a comparable signal on all four – which is generally faster than answering the same diligence questions from every prospective buyer separately.
Navigate superpollutant credits with Sylvera
Superpollutants are a young segment moving quickly, with real near-term climate value and real variation in project quality. Independent assessment is how buyers tell the difference, and how developers demonstrate it.
- Browse the market for free. Sylvera’s free platform gives you access to our full project catalog, filterable by project type – so you can see which LFM, AWD, and OOG projects are rated, and how they compare. [Sign up for free access]
- Go deeper on the methodology. Our frameworks are publicly available: the Landfill Methane (LFM) Ratings Framework, the Alternate Wetting and Drying (AWD) Framework, and the Orphan Oil and Gas (OOG) Well Plugging Framework.
- Developers: if you are building in this segment and want to understand how your project would assess against these frameworks, get in touch.
Request a demo to see how Sylvera helps.