.avif)
“Over the years we’ve invested significantly in our field data team - focusing on producing trusted ratings. While this ensures the accuracy of our Ratings, it doesn’t allow the scale across the thousands of projects that buyers are considering.”

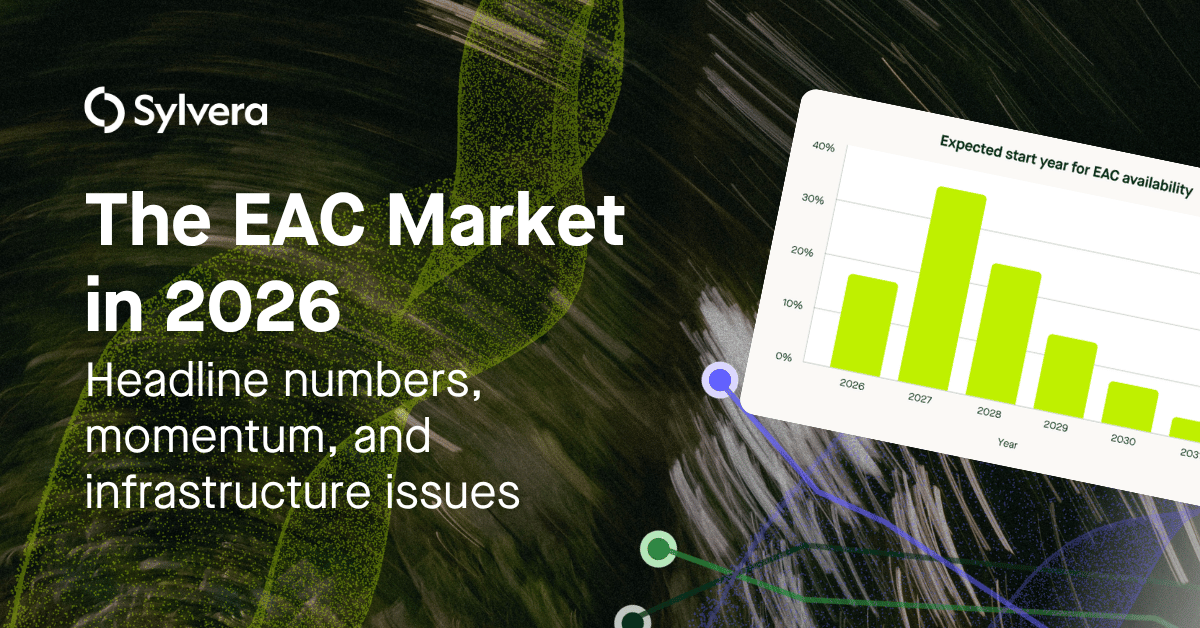
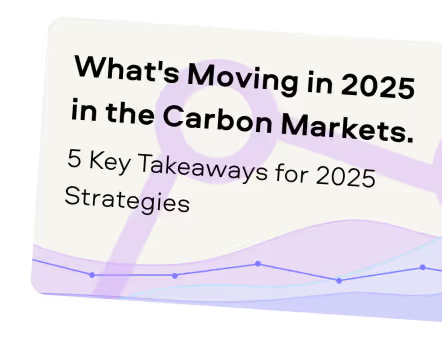
For more information on carbon credit procurement trends, read our "Key Takeaways for 2025" article. We share five, data-backed tips to improve your procurement strategy.
One more thing: Connect to Supply customers also get access to the rest of Sylvera's tools. That means you can easily see project ratings and evaluate an individual project's strengths, procure quality carbon credits, and even monitor project activity (particularly if you’ve invested at the pre-issuance stage.)
Book a free demo of Sylvera to see our platform's procurement and reporting features in action.
Forest inventories shape billions in climate investment, underpinning credit volumes and corporate climate claims. Yet most stakeholders treat inventory outputs as settled facts rather than estimates with real uncertainty. In this article, we explain what forest inventories measure, how methods compare, and what separates decision-grade data from gut feelings.
What Is a Forest Inventory (and What It Is Not)
A forest inventory systematically estimates forest composition, structure, and dynamics over time.
Put simply, the forest inventory process measures tree attributes like diameter, height, and species, then scales the results to predict biomass, carbon stocks, growth, mortality, and disturbance.
Done correctly, forest inventories use the data collected to support forest management, carbon accounting, baseline setting, MRV, risk assessment, and reporting.
It's important to remember: inventories are not single "true" numbers. They're estimates built on sampling, measurement protocols, and modeling choices. As such, they don't guarantee carbon credit integrity and aren't a substitute for ongoing monitoring. The quality of your forest inventories depend on how well your methods, data sources, and sampling designs match your decisions.
.avif)
Why Forest Inventory Quality Matters More Than Ever
The stakes have changed. Thanks to larger investment flows, stricter buyer expectations, and heightened public scrutiny, inventory quality directly determines outcomes.
Poor inventories reduce carbon credit volumes via uncertainty deductions. They also increase permanence and reversal risk, undermine pricing and credibility, and are less defensible during audits.
The most dangerous failure mode, though, is good-looking maps backed by weak ground truth.
Remote sensing products can generate wall-to-wall coverage with appealing visuals, but without robust calibration and validation, those outputs become precision theater. One forest project found this out first-hand when it suffered catastrophic failure and rendered credit retirements worthless.
5 Core Approaches to Forest Inventory Analysis
Think of this as a menu of options, each with distinct strengths and limits. But remember, the best forest inventory sampling methods combine approaches rather than relying on a single data source.
.avif)
Field Plots and Forest Mensuration (The Foundation)
Field plots are the backbone of credible inventory.
Crews measure DBH, height, species, density, deadwood, and sometimes soils at selected locations. The way these crews design their plots, however can vary dramatically:
- Fixed-radius plots sample consistent areas while variable-radius plots adjust for density.
- Systematic grids ensure even coverage while stratified designs target heterogeneity.
Field plots excel at direct measurement and calibration for remote sensing. The USDA Forest Service's FIA program demonstrates this. Its repeated measurements across America's forests create reference data that land managers, state agencies, and researchers use to understand forest conditions, timber volume, and forest health. But plots struggle with cost in remote terrain and have coverage limitations.
Allometry and Biomass Equations (Turning Trees Into Biomass)
Allometry converts field measurements into biomass using statistical relationships between tree dimensions and mass. These equations can be used for large-scale carbon accounting purposes.
It should be known that quality depends on tree species and region fit, plot representation, diameter range, and wood density assumptions. Errors compound when using mismatched equations and inconsistent tree forms, conducting poor extrapolation, or measuring degraded forests. Good practice means transparent equation selection, reported uncertainty, and validation against independent data.
Airborne and Terrestrial LiDAR (Structure You Can Quantify)
LiDAR measures three-dimensional forest structure using laser pulses. This generates precise height distribution and canopy complexity data that scientists use to estimate forest inventory.
LiDAR can be deployed in a few ways. For example, terrestrial laser scanning captures individual trees at ground level, airborne LiDAR maps landscapes, and spaceborne LiDAR samples globally.
Whichever method is used, LiDAR transforms inventory because structure-to-biomass relationships are tighter than optical-only approaches. It fits best in calibration, validation, and high-confidence estimation, though deployment costs, processing complexity, and coverage limits are known constraints.
Satellite Remote Sensing (Scale, Consistency, Time Series)
Satellites provide repeat coverage across large geographies to detect changes in forest inventory.
This approach uses optical sensors to measure reflected light, radar to capture structure through clouds, and satellite LiDAR to sample canopy heights. The combination of these technologies enables forest cover mapping and time-series analysis at spatial scales, which is impossible with plots alone.
However, satellite remote sensing has its challenges, including optical saturation in high-biomass forests, cloud cover, mixed pixels, and model dependency. Good satellite inventory combines multi-sensor approaches, documents uncertainty, and validates against independent ground truth.
Models and Hybrids (Inventory as a System, Not a Dataset)
Most modern inventories are hybrids. First, field plots calibrate remote sensing, which feeds models generating wall-to-wall maps, which are then validated against independent samples.
This process scales ground truth while preserving accuracy. Key concepts include calibration—tuning model parameters with known values—and transferability across forest types.
But be aware: Black-box outputs without documentation undermine trust. When stakeholders can't trace inputs to estimates, they can't assess quality or defend results during audits.
Common Forest Inventory Data Sources (and What to Ask of Each)
Every forest inventory data source has distinct strengths and limitations. Knowing which questions to ask of each source type will help you decide if the data fits your context.
- National Forest Inventories, like the FIA program, provide consistent, long-term data collection across administrative boundaries. FIA data offers reliable information on tree species, forest parameters, and key data on the nation's forests. As such, this forest inventory data source excels at regional trends but may lack project-level resolution, and update cadence varies.
- Project-level inventories include plot networks, proprietary models, and consultant reports that were designed for specific forests. As such, this forest inventory data source offers targeted sampling but introduces cross-project variability without standardization.
- Academic and public datasets provide valuable outputs but carry reuse risks when applied outside intended contexts. For example, when training data doesn't match your forest type.
- Commercial biomass products promise coverage and updates. Demand transparency on methods, training data, validation strategy, uncertainty, and update frequency before buying.
.avif)
Your Minimum Documentation Checklist
- Sampling design + plot location rationale (or disclosure constraints)
- Measurement protocols and QA/QC procedures
- Allometric equation choices and justification
- Calibration/validation strategy (including independent data)
- Uncertainty reporting and confidence intervals
- Versioning and update cadence
- Traceable lineage from raw inputs to outputs
What "Good" Looks Like: The 8 Quality Signals
"Good" means decision-grade, not perfect.
A decision-grade inventory provides enough accuracy, transparency, and validation to support your specific choice. Here are eight quality signals:
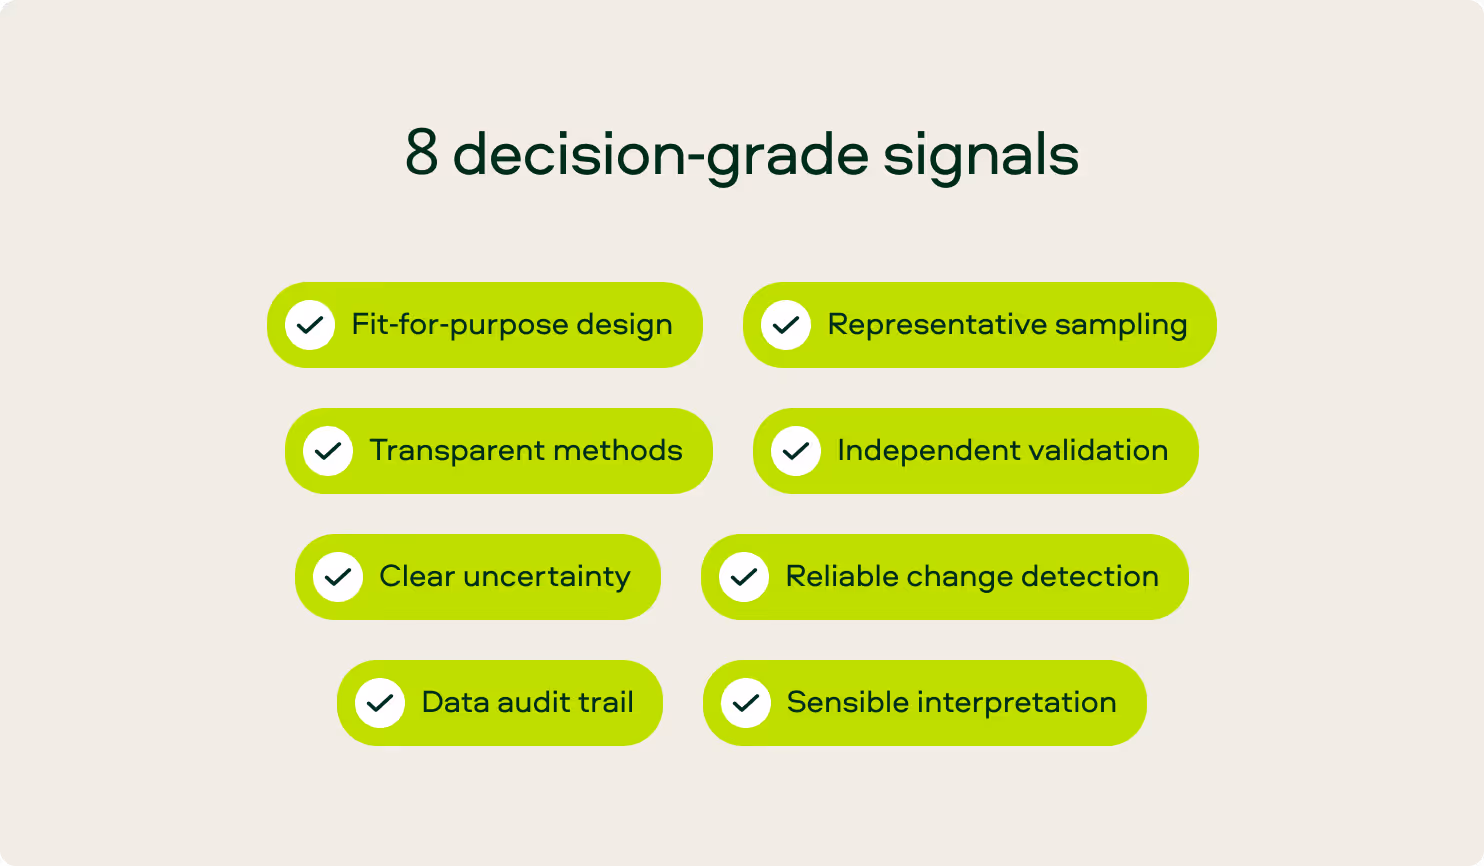
- Fit-for-purpose design: Your design should match your intended use. Are you interested in management, crediting, or reporting? Your answer dictates your actions.
- Representative sampling: Stratification should reflect forest heterogeneity. Treating diverse landscapes as homogeneous introduces systematic bias.
- Transparent methods: You should document every equation, model, and assumption. Mystery algorithms undermine credibility whereas transparency builds trust.
- Independent validation: Validation from an independent, third-party company like Sylvera verifies accuracy. Since accuracy leads to trust, this is a big deal.
- Clear uncertainty: Always report your confidence levels. If you're uncertain about something, it should be made clear. It should not be buried—or worse, omitted.
- Change detection capability: Prioritize clear baselines and consistent monitoring. Doing so will distinguish true growth from measurement noise.
- Data provenance and audit trail: Aim for version control, clear documentation, and easy reproducibility to enable audits and build confidence.
- Sensible interpretation: Avoid overclaiming precision. Instead, offer credible ranges, which are more honest and help avoid catastrophic scenarios.
6 Typical Pitfalls (and How to Spot Them Fast)
Even well-intentioned inventory efforts can produce misleading results. Here are six pitfalls that undermine inventory credibility—and the red flags that help you spot them quickly.
- Too few plots: Sample plots don't capture variability across forest conditions and tree size classes. Red flag: large areas with few plots and no stratification logic.
- Generic allometry misapplied: Using equations outside their region or species bounds generates predictable errors. Red flag: no discussion of equation selection or limits.
- Satellite-only claims without uncertainty: Optical sensors can saturate in dense forests. Red flag: precise biomass maps without ground calibration or uncertainty data.
- Single-date baselines: Treating one snapshot as "the baseline" ignores natural variability. Red flag: baselines without temporal variation accounting.
- Maps without validation: Wall-to-wall products mean nothing without validation statistics. Red flag: a "pretty map" where outputs are shown, but accuracy is hidden.
- Stock confused with impact: Carbon stock differs from additional carbon a project generates. Red flag: inventory presented as impact proof without counterfactuals.
.avif)
How Forest Inventory Links to Forest Carbon Projects and Claims
Forest inventories are used in multiple ways. For example, they...
- Establish baselines and stratification
- Generate crediting calculations by quantifying stocks and changes
- Enable monitoring for degradation and disturbance, and
- Support uncertainty deductions and buffer approaches.
These things are important for developers because inventory quality affects credit volumes, risk, and revenue. They're also important for buyers and investors because inventory quality determines whether credits represent real, additional, and permanent carbon.
Sylvera’s Biomass Atlas directly supports all functions.
For project developers: Independent baseline validation in hours instead of months of plot sampling; 25 years of historical data for additionality assessment; continuous monitoring capabilities.
For registries: Verification infrastructure that scales without scaling staff; standardized methodology that works across unlimited projects
For governments: Credible baselines for REDD+ or Article 6 programs; wall-to-wall coverage for National Forest Monitoring Systems
For buyers and investors: Independent verification of carbon stock claims; transparent uncertainty for risk assessment; due diligence data accessible via API
Where Sylvera Stands on Forest Inventory Quality
At Sylvera, we believe forest inventories should be verifiable, comparable, and transparent. This is especially true when they're used to support carbon claims and market transactions.
In practice, this means combining the best available sensing, like LiDAR-enabled structure signals where appropriate, with robust ground truth. It also means prioritizing uncertainty clarity over point estimates, and validating consistently across geographies to reduce "methodology roulette."
Good news: the Sylvera’s Biomass Atlas helps stakeholders evaluate forest carbon measurement approaches with market-leading biomass data. And, our suite of tools supports better decisions across procurement, investment, and development. Request a free demo to learn more.
.avif)
Take Control of Forest Resources
Forest inventories are powerful tools, but they're only as credible as their design and data.
"Good" means fit-for-purpose, transparent, validated, and honest about uncertainty. This means more integration between plots, LiDAR, and satellites, and more scrutiny as climate finance scales.
Ultimately, the best inventories support better forests and better climate outcomes by reducing the misallocation of capital and credibility risk that can tank projects.