.avif)
“Over the years we’ve invested significantly in our field data team - focusing on producing trusted ratings. While this ensures the accuracy of our Ratings, it doesn’t allow the scale across the thousands of projects that buyers are considering.”

For more information on carbon credit procurement trends, read our "Key Takeaways for 2025" article. We share five, data-backed tips to improve your procurement strategy.
One more thing: Connect to Supply customers also get access to the rest of Sylvera's tools. That means you can easily see project ratings and evaluate an individual project's strengths, procure quality carbon credits, and even monitor project activity (particularly if you’ve invested at the pre-issuance stage.)
Book a free demo of Sylvera to see our platform's procurement and reporting features in action.
The carbon credit market generates billions in market value, and there's a rising demand to secure credits before 2030. But these facts don't answer the critical questions for developers:
- Who buys credits?
- When do they buy credits?
- What criteria do they prioritize?
- Will my project find buyers when credits issue?
To understand demand, you must go beyond aggregate numbers to track buyer behavior, recognize market fragmentation, and align timelines with actual procurement. This article breaks down what drives demand, how it's changing, and what signals developers should monitor.
What Do We Mean by Carbon Credit Demand?
There's a difference between carbon credit demand, commitments, and purchases.
- Carbon credit demand represents the total potential market need based on corporate climate targets, compliance obligations, and net-zero pledges. This theoretical demand generates headlines and market forecasts but does not directly guarantee transactions.
- Carbon credit commitments include announced intentions, procurement targets, and forward offtake agreements. These signal buyer interest but vary in binding strength. For example, some are contractually firm while others are purely aspirational.
- Carbon credit purchases occur when buyers complete financial transactions and/or retire credits. It's measured through registry retirements and verified transactions.
Of note, demand is episodic, not continuous. Most buyers work within annual procurement cycles tied to budget windows and reporting deadlines. Purchasing often clusters around specific moments, like Q4 for voluntary carbon market participants and regulatory deadlines for compliance buyers.
Confidence, credibility, and delivery risk determine whether theoretical demand converts to transactions. After all, buyers screen for quality, additionality, and permanence before committing capital. Projects that demonstrate these attributes generate more revenue.
3 Main Sources of Carbon Credit Demand
Demand comes from distinct buyer segments with different motivations, timelines, and quality expectations. Here's what developers need to know:
.avif)
Corporate Voluntary Demand
Corporations that pursue net-zero targets drive voluntary carbon market activity via internal carbon pricing and predictable procurement cycles. Though, sector differences really matter.
Energy and utilities dominate demand, representing 56% of carbon credit retirements in 2025. Within this sector, nearly 70% of retired credits come from forestry and land use projects—REDD+, IFM, and ARR. This reflects both emission scale and preference for nature-based solutions that align with environmental goals.
Professional services firms favor household and community projects, particularly cookstove programs that deliver tangible co-benefits. Then there are technology companies, which attract attention for durable carbon dioxide removal (CDR) offtakes, but durable CDR represented just 0.1% of their actual retirements in 2025. In other words, CDR is still a nascent market.
For more detail around who’s buying what, check our State of Carbon Credits report.
Developers should understand which industries buy their project type, at what prices, and with what frequency. That way, they can present their projects in favorable ways.
Compliance Demand
Compliance programs increasingly shape demand. As of 2025, compliance and quasi-regulated markets represent approximately 23% of all credits retired or cancelled.
The Carbon Offsetting and Reduction Scheme for International Aviation (CORSIA) exemplifies this shift. Projections suggest compliance demand could exceed voluntary demand in 2027, driven by the CORSIA phase 1 deadline in January 2028. Predicted demand for CORSIA-eligible credits is between 150 and 210 million by 2030, if implemented as planned.
This regulatory pressure from emissions trading systems and international aviation creates more predictable demand than voluntary commitments but introduces constraints. Eligibility requirements, vintage restrictions, and approval processes mean developers must design projects with regulatory frameworks in mind from the beginning.
Early signals from Article 6 mechanisms under the Paris Agreement add another layer. As countries operationalize these frameworks through nationally determined contributions, demand patterns will shift. In all likelihood, developers who track policy developments will gain a strategic advantage in project design and timing.
Investor-Driven and Balance-Sheet Demand
A small cohort of sophisticated buyers drives disproportionate market activity through portfolio hedging, pre-issuance offtakes, and strategic supply locking.
In 2025, offtake agreements totaled $12.3 billion—over 12 times the value of credits retired. This reflects forward deals among roughly 100-200 buyers who paid an average of $160 per credit for removals-focused projects, specifically durable CDR. Companies sign long-term offtakes to secure future supply against concerns that tight markets could increase prices or limit options toward 2030.
Among the 80 largest offtakers tracked by Sylvera, volumes skew heavily toward a few players. The top five include Microsoft (58%), the LEAF Coalition (11%), Meta (5.6%), the LNG Alliance (4.8%), and CitiBank (4.7%). As such, connecting with a few high-end buyers could prove more financially successful than chasing hundreds of smaller ones.
For developers, this creates opportunity and risk. Early-stage capital flows to projects demonstrating credible offsets and high-integrity credits. But dependence on a narrow buyer base means shifts in a single company's strategy can ripple through entire project pipelines.
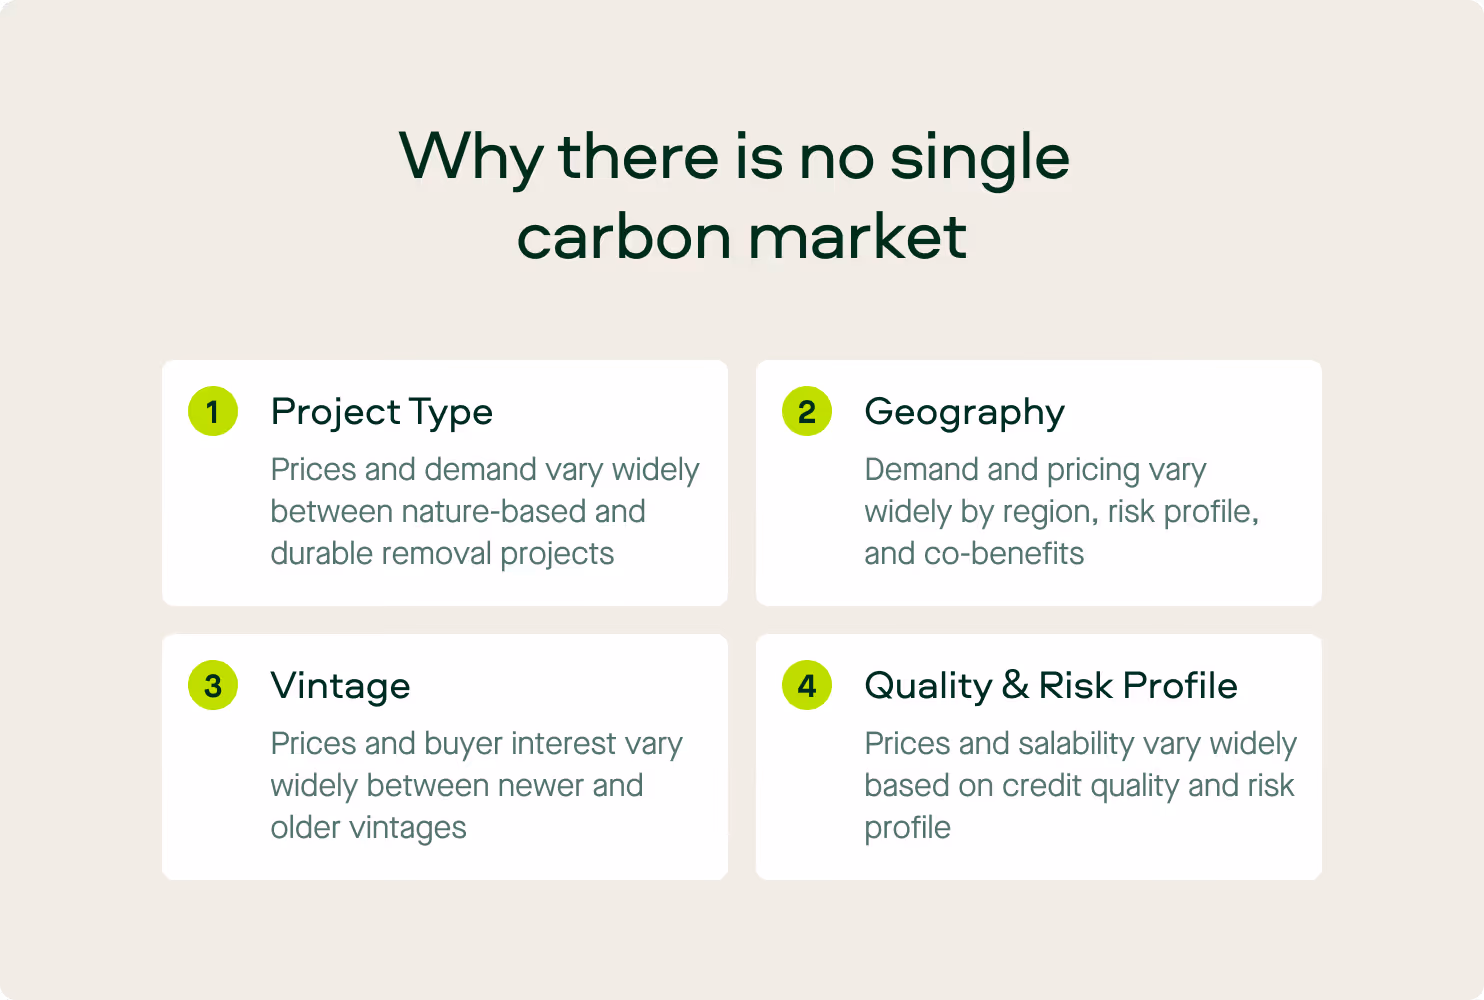
Why Carbon Credit Demand Is Not One Global Carbon Credit Market
Talk of "the carbon market" obscures reality. Demand is fragmented across project types, geographies, vintages, and perceived quality in ways that make some credits nearly unsellable while others command premiums. Let's dig deeper:
- Project type creates the deepest divide. Buyers spent $590 million on forestry and land use in 2025, with retirements shifting away from legacy REDD+ toward IFM, ARR, and agriculture projects. Meanwhile, a small group of buyers pays $160 per credit for durable CDR—100 times typical prices for nature-based projects in voluntary markets.
- Geography can impact demand as well. Some buyers prioritize projects in developing economies because of the co-benefits and development impact. Others prefer jurisdictions with strong environmental integrity and lower delivery risk.
- Vintage affects both price and salability. Recent vintages typically trade at premiums, while older credits are sometimes viewed as irrelevant to current climate targets. Buyers committed to science-based targets initiative frameworks tend to prioritize vintage data.
- Quality and risk profile help determine if credits sell at all. Overall market quality has improved gradually—BBB+ credits represented 23% of issuances in 2025 (up from 14%) and 31% of retirements (up from 25%). But improvement is slowing due to limited supply of high-quality credits, increased prices, and the number of low-quality credits available.
This is why "total market size" headlines hide real behavior. Growing market value doesn't translate to demand for every project. The shift from volume-first to quality-screened demand means buyers concentrate on fewer credits that meet their unique, often stringent criteria.
Quality as a Demand Filter
Credit quality is a market filter, not just a pricing mechanism.
Corporate buyers face growing scrutiny from stakeholders, regulators, and the public. Lower-quality credits expose them to reputational risk and greenwashing accusations. As such, demand gravitates toward projects that demonstrate robust additionality and permanence.
Co-benefits and reputational alignment also influence decisions. Projects that deliver conservation, community development, or environmental benefits beyond greenhouse gas emissions reduction are prized by buyers who align carbon offsetting and sustainability goals.
This quality filter operates differently across project types. For nature-based solutions, buyers assess leakage risk, baseline accuracy, and monitoring protocols. For tech-based removal like direct air capture, they view energy efficiency, lifecycle emissions, and storage permanence.
Put simply, developers should ensure project quality from the beginning to enjoy success.
Timing Matters More Than Volume in the Carbon Market
Developers underestimate how timing shapes demand. Understanding when buyers purchase is just as important as knowing what they buy.
Corporate procurement cycles follow annual budgets and sustainability reporting windows. Many companies finalize carbon credit purchases in Q4 for calendar-year reporting. This creates predictable demand surges but allows Q1 credits to sit for longer before finding buyers.
Verification and issuance timing introduces complexity. Credits issued before a buyer's procurement cycle closes may sell quickly. Credits issued after may wait an entire year before they're purchased. This timing mismatch creates inventory risk for developers to manage.
We should also mention, spot purchases and forward offtakes follow different timelines. Spot buyers want immediate delivery of issued credits. Forward buyers commit capital years before issuance but demand extensive upfront due diligence and quality assurances.
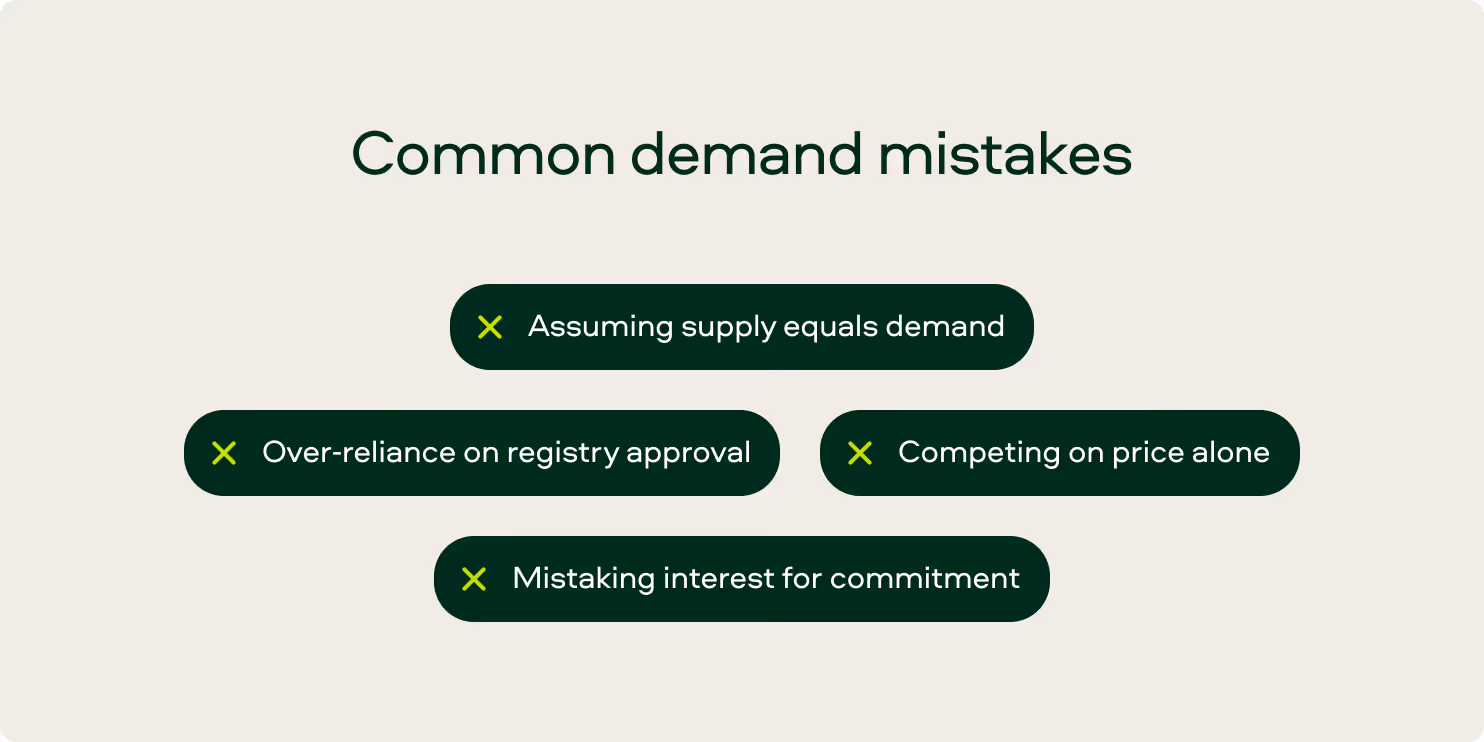
What Developers Often Get Wrong About Demand
Developers make common mistakes regarding demand—and create unnecessary risk:
Assuming demand is guaranteed once credits exist is the most common pitfall. Registry acceptance proves a project meets methodology requirements but says nothing about market demand. Hundreds of registered projects have issued credits that go unsold for years.
Over-reliance on registry acceptance alone compounds this error. Registries validate methodologies and verify emission reductions but don't assess market appetite, price expectations, or buyer preferences. A registered credit is necessary but not sufficient for sales.
Misjudging price sensitivity vs delivery confidence leads developers to compete on price when buyers prioritize reliability. Top buyers pay premiums for strong track records, transparent monitoring, and low delivery risk. Price cuts signal weakness, not competitive advantage.
Treating "buyer interest" as firm demand wastes time and capital. Letters of intent, memoranda of understanding, and expressions of interest don't convert without due diligence, legal commitment, and payment terms. Distinguish soft signals from hard commitments.
What Developers Should Track to Understand Demand
As a developer, you can monitor specific signals to identify buyer behavior and emerging trends. Here are three things to track to stay ahead of the curve:
Buyer Behavior Signals
Track who buys what project types, and at what quality bands, prices, vintages, and geographies. This will sharpen your positioning and outreach efforts.
Also, industry preferences reveal patterns. Energy companies favor nature-based solutions. Technology companies announce durable CDR offtakes but retire mostly conventional credits. Professional services like community co-benefits. Match buyers preferences to your project.
One more thing: one-off purchases and repeat buyers signal different things. Repeat buyers demonstrate consistent demand and established procurement processes. One-off buyers may have experimented but haven't committed to ongoing programs.
Market Balance Indicators
Issuances and retirements reveal supply-demand dynamics.
When retirements exceed issuances, inventory draws down and prices strengthen. When issuances outpace retirements, inventory builds and prices stagnate—or even slump.
Inventory build-up or drawdown by project type provides granular insights. Some categories face oversupply while others show tight markets. Developers should aim to understand their specific segment rather than aggregating data across the entire market.
Also, forward commitments and spot activity indicate buyer confidence and market maturity. High forward volumes suggest buyers expect future supply constraints.
Price Signals
Price dispersion by quality and project type reveals what buyers value.
High-quality credits command more substantial premiums than low-quality credits within the same category. This gap tells developers what attributes drive pricing power.
At the same time, volatile prices suggest uncertainty about fundamental value. Stable prices with clear quality-based differentiation suggest a maturing market.
Premiums for specific attributes—biodiversity co-benefits, community development, or innovative removal methods—signal emerging buyer preferences. Tracking these premiums helps developers decide which project features justify additional investment.
.avif)
How Demand Is Changing Toward 2030
Demand may increase toward 2030, but it will likely concentrate on fewer, higher-quality projects. As such, expect a more selective market, not an easier one.
Disclosure pressure from frameworks like the Task Force on Climate-related Financial Disclosures accelerates this trend. As companies report climate-related risks and residual emissions, they'll scrutinize carbon credit quality. Low-quality credits create compliance risk.
Also, climate litigation and scrutiny of corporate climate claims push buyers toward conservative, defensible purchases. Legal challenges to greenwashing make buyers risk-averse. That's why most prefer credits with robust third-party validation over cheap alternatives.
Supply discipline shapes future demand too. If issuance grows faster than retirements, oversupply reduces urgency and prices. If supply constraints emerge, particularly for quality nature-based solutions or scalable renewable energy projects, offtake agreements rise.
It's important to remember: demand growth doesn't mean easy sales. It means more buyers with higher standards, more sophisticated due diligence, and less tolerance for uncertainty.
Implications for Project Developers
Demand dynamics should change the way developers approach project design, financing, and commercial strategy. Understanding these dynamics is key to success.
First, design projects with demand realism. To do so, you'll need to identify specific buyer segments before finalizing parameters. Ask yourself, "Which companies buy this project type? What quality standards do they require? And what price range do they pay?" Design backward from buyer preferences rather than forward from what's technically feasible.
Second, align timelines with procurement behavior to reduce inventory risk. This can be done by mapping major buyers' fiscal calendars, regulatory deadlines, and reporting cycles. Once done, time project milestones to deliver credits when buyers actively procure.
Understanding demand early affects everything downstream. Financing improves when developers demonstrate clear paths to offtake agreements. Pricing strategy becomes more sophisticated when tracking real-world prices by quality band and project type.
Also, risk allocation in offtake agreements depends on understanding buyer risk tolerance. Some accept delivery risk for lower prices, others demand guaranteed delivery regardless of project performance. This knowledge should impact your strategy.
Key Takeaways
Carbon credit demand is real but selective. The market rewards projects that understand buyer behavior, deliver on quality commitments, and time delivery to procurement cycles.
As such, the developers who track demand signals early reduce commercial risk. Said developers will put themselves in the best positions to succeed—both now and in the future.
Want deep market insights you can use to build better projects and stimulate carbon credit demand? Sylvera’s Market Intelligence is the one-stop central hub used by market players to understand market trends and dig into buyer purchasing behaviour.
Request a free demo of Sylvera to see how our platform helps developers.