“Over the years we’ve invested significantly in our field data team - focusing on producing trusted ratings. While this ensures the accuracy of our Ratings, it doesn’t allow the scale across the thousands of projects that buyers are considering.”

For more information on carbon credit procurement trends, read our "Key Takeaways for 2025" article. We share five, data-backed tips to improve your procurement strategy.

One more thing: Connect to Supply customers also get access to the rest of Sylvera's tools. That means you can easily see project ratings and evaluate an individual project's strengths, procure quality carbon credits, and even monitor project activity (particularly if you’ve invested at the pre-issuance stage.)
Book a free demo of Sylvera to see our platform's procurement and reporting features in action.
Headline numbers
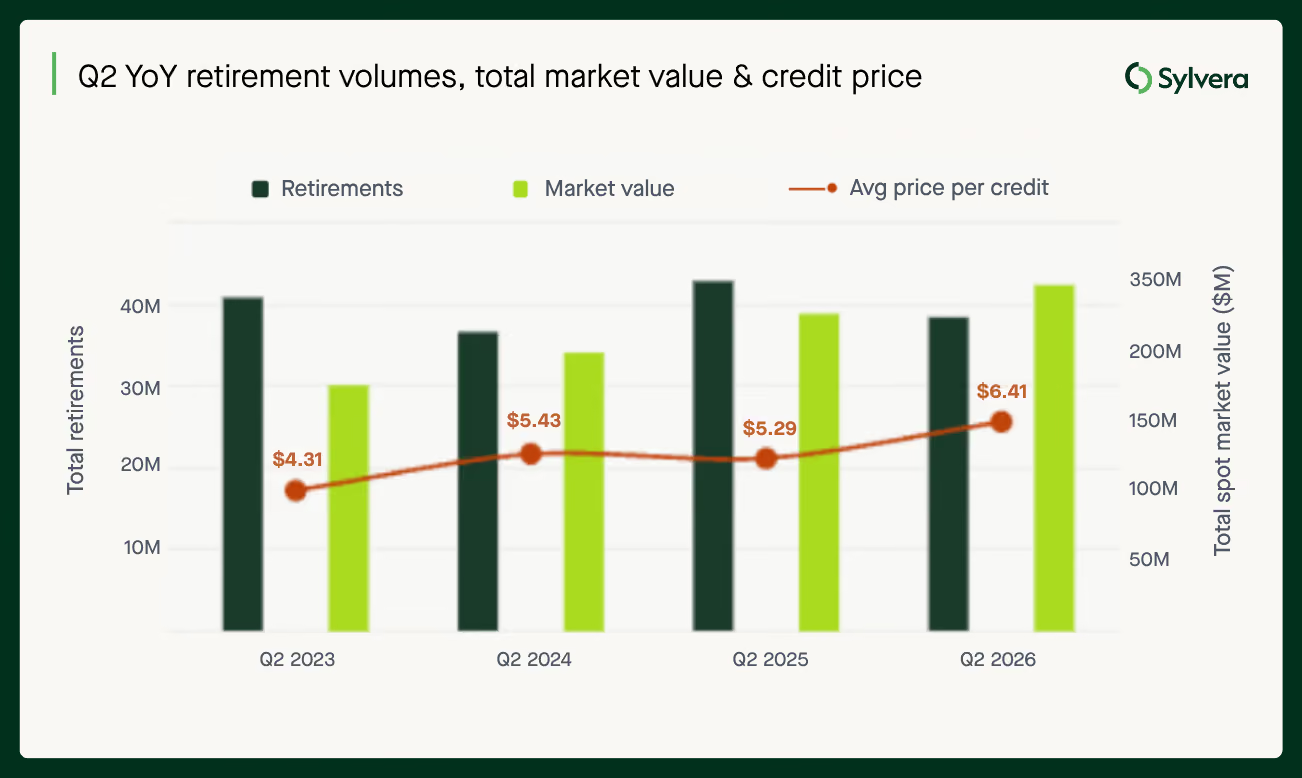
Carbon credit retirements reached 38.55 million in Q2 2026, down 10% from 42.9 million in the same period last year. Across the first half of the year, retirements totalled 89.27 million, down 9% from 98.27 million in H1 2025.
A meaningful share of that decline is due to Shell, historically the market's largest retiree. In H1 2025 Shell had retired 6.7 million tonnes, dropping to just 494,100 tonnes in H1 2026. This gap accounts for around two-thirds of the entire market's year-on-year retirement drop-off.
Despite the volume decline, market value held up. Total retirement market value for Q2 2026 was $247 million, up from $227 million a year earlier, and H1 2026 value reached $548 million, up from $524.21 million in H1 2025.
As highlighted in Sylvera's State of Carbon Credits report, the market continues to be defined by a volume vs. value dynamic. The average price paid per credit retired rose to $6.41 in Q2 2026, up from $5.29 in Q2 2025 - and for H1 2026 as a whole, average price reached $6.13, up from $5.33 a year earlier.
Quality and price
Investment-grade (≥BBB) credits continue to command a high share of market value. In Q2 2026, ≥BBB credits made up 27% of rated retirement volume but 51% of rated market value.
The size of that premium varies by project type. ARR has a clear structural quality premium, with BBB+-rated ARR credits selling for an average of $28.55 in H1 2026 versus $9.12 for ≤BB-rated ARR - over a 3x premium.
IFM's premium is more recent. The gap between BBB+ and ≤BB IFM prices sat at just $1.32 in H1 2025 and has since widened to $5.59 in H1 2026, driven by BBB+ IFM prices rising ($16.34 → $18.65) while ≤BB IFM prices fell ($15.02 → $13.06).
REDD+ shows a similar divergence. BBB+ REDD+ prices rose 71% year-on-year to $8.40, while low-rated (≤BB) REDD+ fell 26% to just $1.82. The quality spread between the two has widened from $2.47 in Q2 2025 to $6.58 in Q2 2026, further evidence that the market is discriminating on quality within project types.
Rated issuances increasing in quality
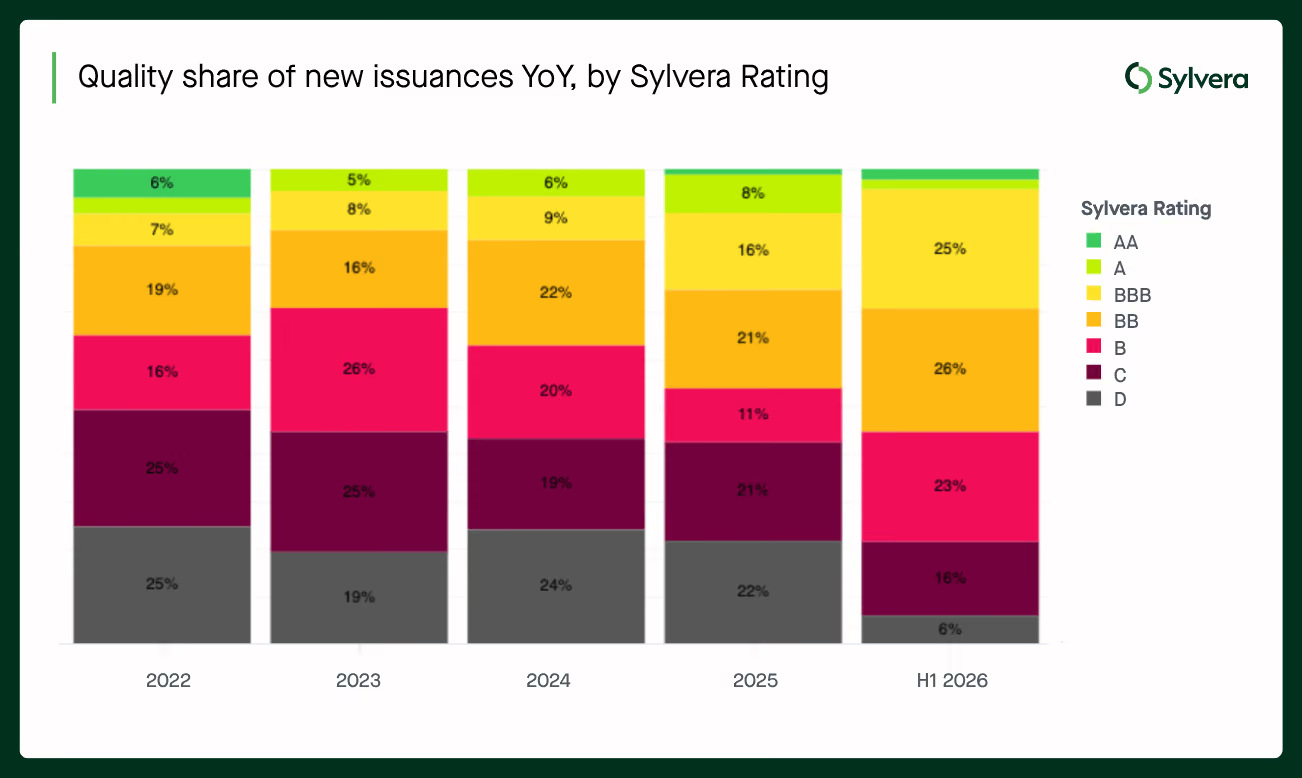
The underlying quality of new issuances continues to improve. Investment-grade (≥BBB) issuances have risen from a consistent 13-16% across 2022-2024, to 25% in 2025, to 29% in H1 2026. The bottom end of the market is shrinking, with C and D-rated issuances, which made up 43% of the rated pool in both 2024 and 2025, was at 22% in H1 2026.
Project types: cookstoves hold strong
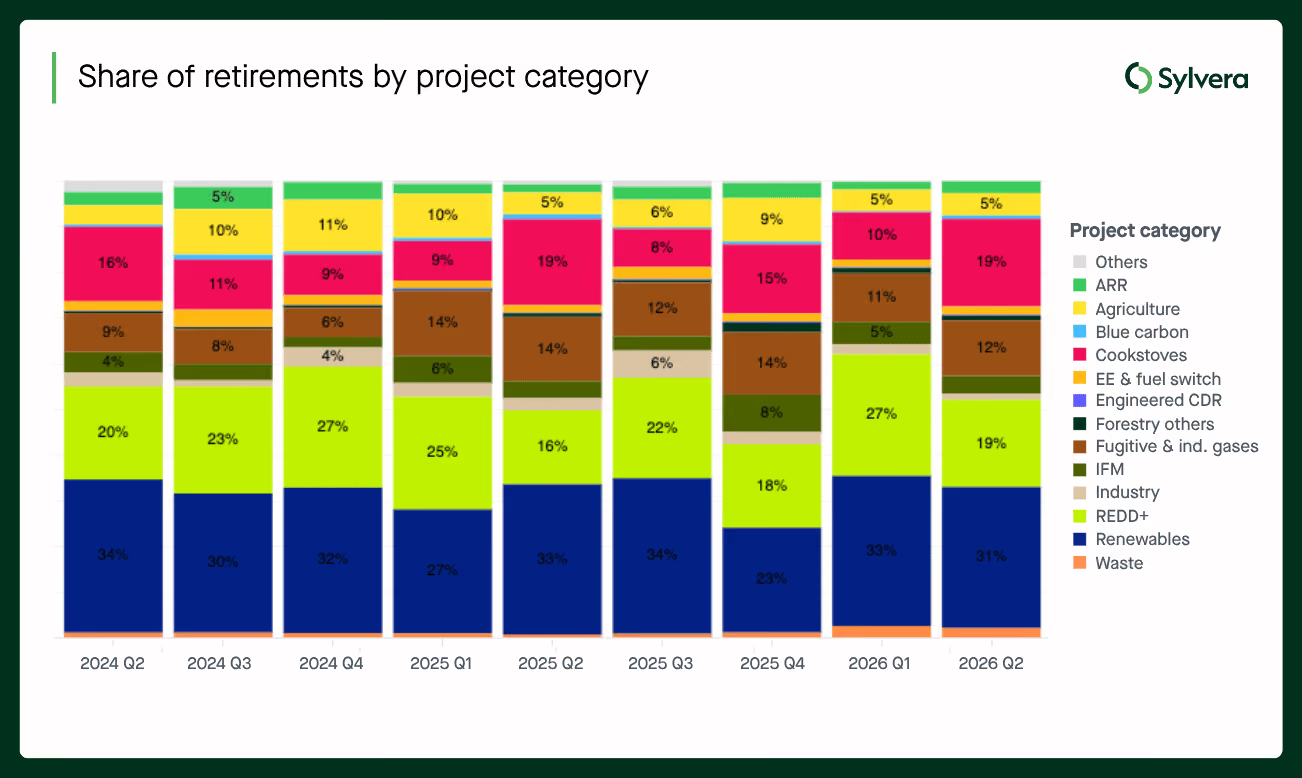
Cookstoves drew level with REDD+ as the largest share of retirements (19%) for the first time in Q2 2026, jumping from fourth largest share (10%). The top four project types account for 61% of all retirements. Renewable energy types (wind, hydro, and other renewables) remain a significant segment at 31% of retirements.
H1 2026 issuances totalled 96.8 million, down 31.9% from 142.3 million in H1 2025. Cookstoves continued to hold strong with the greatest share at 19% Q2 issuances, while fugitive and industrial gases and landfill methane surged to become the second- and third-largest issuance categories.
And in terms of registries, American Carbon Registry (ACR) fell from the largest single issuer in Q2 2025 (33% share) to just 7% in Q2 2026, while Verra has risen from 21% to 45% share over the same period. The ACR drop has two factors: a 15.2-million-credit decline in industrial issuances, and a 96% collapse in ACR's IFM issuance pipeline (6.3 million to 276,000 credits.
Forward offtake market continues to diversify
The forward offtake market is often where large and sophisticated buyers procure carbon credits. While many such offtakes remain private, Sylvera aggregates underlying data to the extent that they could be disclosed publicly.
Amongst the disclosed offtakes, total offtake volumes announced fell 65% year-on-year to 21.52 million tonnes in H1 2026 (from 61 million), and total value dropped 70% to $2.25 billion (from $7.46 billion).
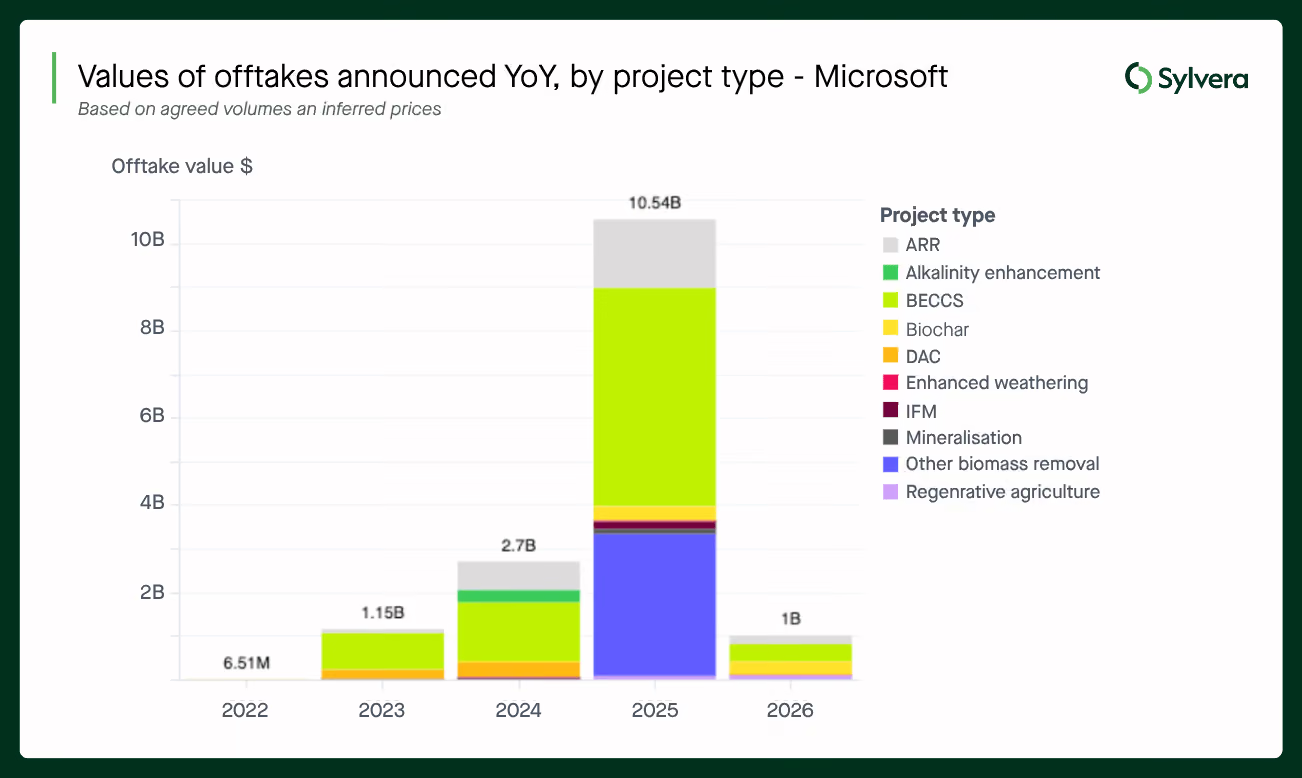
Microsoft's pullback explains most of the story. In H1 2025, Microsoft alone accounted for 54.08 million tonnes of the market's 61 million - 88.7% of all new offtake volumes. In H1 2026, Microsoft's announced offtake volumes fell 82% to 9.52 million tonnes.
Putting Microsoft aside, the rest of the market actually grew. Non-Microsoft offtake volume rose 73% year-on-year, from 6.92 million tonnes in H1 2025 to 12.0 million tonnes in H1 2026. Woodside emerged as the second-largest offtaker in H1 2026 at 6 million tonnes - double the second-highest H1 2025 offtaker.
Biochar is the offtake growth story of 2026. Offtake volume rose 79% year-on-year to 3.17 million tonnes (from 1.77 million), with value up 80% to $806 million (from $448 million). It now accounts for around 15% of offtake volume and 36% of offtake value.
ARR has the largest share of volume with 58% of all offtakes. But in-line with the market, ARR offtakes fell 64% to 12.32 million tonnes (from 34.4 million) and value fell 64% to $616 million - tracking Microsoft, whose ARR offtake dropped 87% (31.4M → 4M tonnes). But non-Microsoft ARR volume nearly tripled over the same period, from 3.0 million to 8.32 million tonnes.
In BECCS and DAC, non-Microsoft demand hasn't picked up. BECCS volume fell 85% to 2.07 million tonnes and value fell 85% to $637 million (from 14.14 million tonnes / $4.28 billion). Microsoft's BECCS offtake fell 90% (13.3M → 1.28M tonnes), while non-Microsoft BECCS volume was essentially flat (0.84M → 0.79M). DAC volume dropped 93% to 46,000 tonnes and value down 93% to $32 million.
SBTi's Corporate Net-Zero Standard V2
Q2 2026 saw the release of the SBTi Corporate Net-Zero Standard V2, which formally recognises carbon credits for the first time. Following the SBTi update, we analysed credit retirement patterns against SBTi-aligned company emissions to model what formal recognition would actually require. The gap between current practice and what the Standard implies is stark.
SBTi-aligned companies - estimated at 11,000 globally, covering an estimated 34.5 billion tCO₂e of Scope 1-3 emissions - retired just 20 million credits in the past year, equivalent to 0.06% of their footprint, against an Engaged-status threshold of 1%. Sylvera's modelling shows even moderate alignment (Scenario A) would push demand from SBTi-aligned companies to 55 million tonnes by 2030 and 293 million by 2035; a more bullish scenario (Scenario C) reaches 224 million by 2030 and 1.1 billion by 2035.
Achieving Leadership status - full offsetting of Scope 1-3 emissions - remains seemingly out of reach for virtually all companies today, and even Advanced status will stretch most buyers. Whether the market can mobilise credible, high-quality supply fast enough to meet this latent demand is now one of the central questions in the market. For the full breakdown of the Standard, see our dedicated analysis.
Potential demand from SBTi companies*:
*Assuming SBTi-covered emissions remain stable through 2030-35, potentially if the rate of emissions reductions are matched against the rate of increased SBTi participation.
CORSIA: a supply squeeze meeting an approaching deadline
Aviation demand for CORSIA credits has started, with 502k CORSIA credits retired in H1 2026, up from just 14k in the whole of 2025.
CORSIA-aligned credit* issuances grew through the first half of the year, rising from 52% of all new issuances in 2025 to 64% in Q2 2026 - reinforcing the structural shift toward compliance-aligned supply that's been building since 2023.
Alongside the launch of Sylvera’s Article 6 & CORSIA Hub, our latest analysis of the market showed that of the roughly 300 million credits issued to date that are potentially eligible for CP1*, only 38 million have actually cleared the two hurdles that convert a credit into an Eligible Emissions Unit (EEU): a host-country Letter of Authorization (LoA), and either a corresponding adjustment (CA) or qualifying insurance.
That's 13% of the potentially eligible pool, and against Sylvera's base-case CP1 demand estimate** of 163 million EEUs, current supply covers only around 23% of what the market will ultimately need. Even in the best case, where the pool of CORSIA aligned credits grows to 640 million by the January 2028 deadline, only 104 million sit in countries likely able to deliver LoAs and CAs at all - and just 48 million meet every requirement today. Only 21% of assessed countries currently show high confidence of delivering both.
In terms of demand, our base case of 163 million EEUs could move materially on three swing factors: the US-Iran conflict, which could suppress demand by 4-9% depending on duration; the European Commission's CORSIA review, due in July 2026, which could cut demand by as much as 24% if EEA flights move under the EU ETS instead; and the possibility of US airlines opting out absent a domestic enforcement mandate, which alone could remove around 18% of demand.
And in terms of CORSIA EEU pricing, our forecast indicates that EEU prices can range $15-53 depending on the different supply-demand outcomes as the Jan 2028 deadline approaches, with $33 as the median outcome. You can read our full CORSIA analysis here.

CCPs as a quality signal
Core Carbon Principles (CCP) are increasingly functioning as a proxy for project quality, not just compliance-readiness. Sylvera's ratings data shows CCP-aligned projects skew sharply toward higher grades: 36% hold a BBB rating and a further 36% sit at B.
Non-CCP-labelled projects, by contrast, are concentrated at the bottom of the scale — 18% rated D and 25% rated C — largely a function of the renewable energy credits that still make up a significant share of that pool.
In terms of project types, CCP-labelled supply is dominated by IFM, LFM, cookstoves and agriculture - these have broadly driven the market's general quality improvements - while the non-CCP-labelled pool still carries legacy renewables and REDD+ credits that pull the average down.
As buyers increasingly use CCP status as a first-pass filter, this divergence suggests the label is doing real work in steering capital toward higher-integrity supply, rather than simply tracking it after the fact.
This shows up directly in the issuance data: CCP accreditation has grown from under 3% of issuances in 2023 to 21.4% in Q1 2026 and 27.5% in Q2 2026 - more than a quarter of all new supply now carries CCP accreditation, up from 24.5% across H1 as a whole.
* eligible subject to host country authorisation.
**this demand estimate is based on CP1 scope, but excludes intra-EEA flights and smaller states
More Levers, Harder Choices: Carbon Credits, Commodities & EACs Under SBTi V2
Now that there's more than one way to move a scope 1/2/3 number, the core questions buyers keep asking is simple: what are the real options? What does each cost per tonne? And where do they actually count?
Carbon credits, physical lower-carbon supply, and EACs are usually priced and evaluated on their own terms. This webinar will place them in one room and price them against each other.

Want to explore these market dynamics yourself?
Our Market Intelligence suite provides transparency across the market with real-time pricing, supply and demand data.
💲 Pricing Data – Project-level spot estimates, with 20,000+ estimates powered by ~300,000 transactions.
📈 Market Data – Weekly issuances and retirements, filterable average prices, and known supply integration.
🏢 Buyer Directory – See who’s retiring what by sector, type, vintage, and geography to validate demand.
Find out more about Market Intelligence here, or request your free demo now.