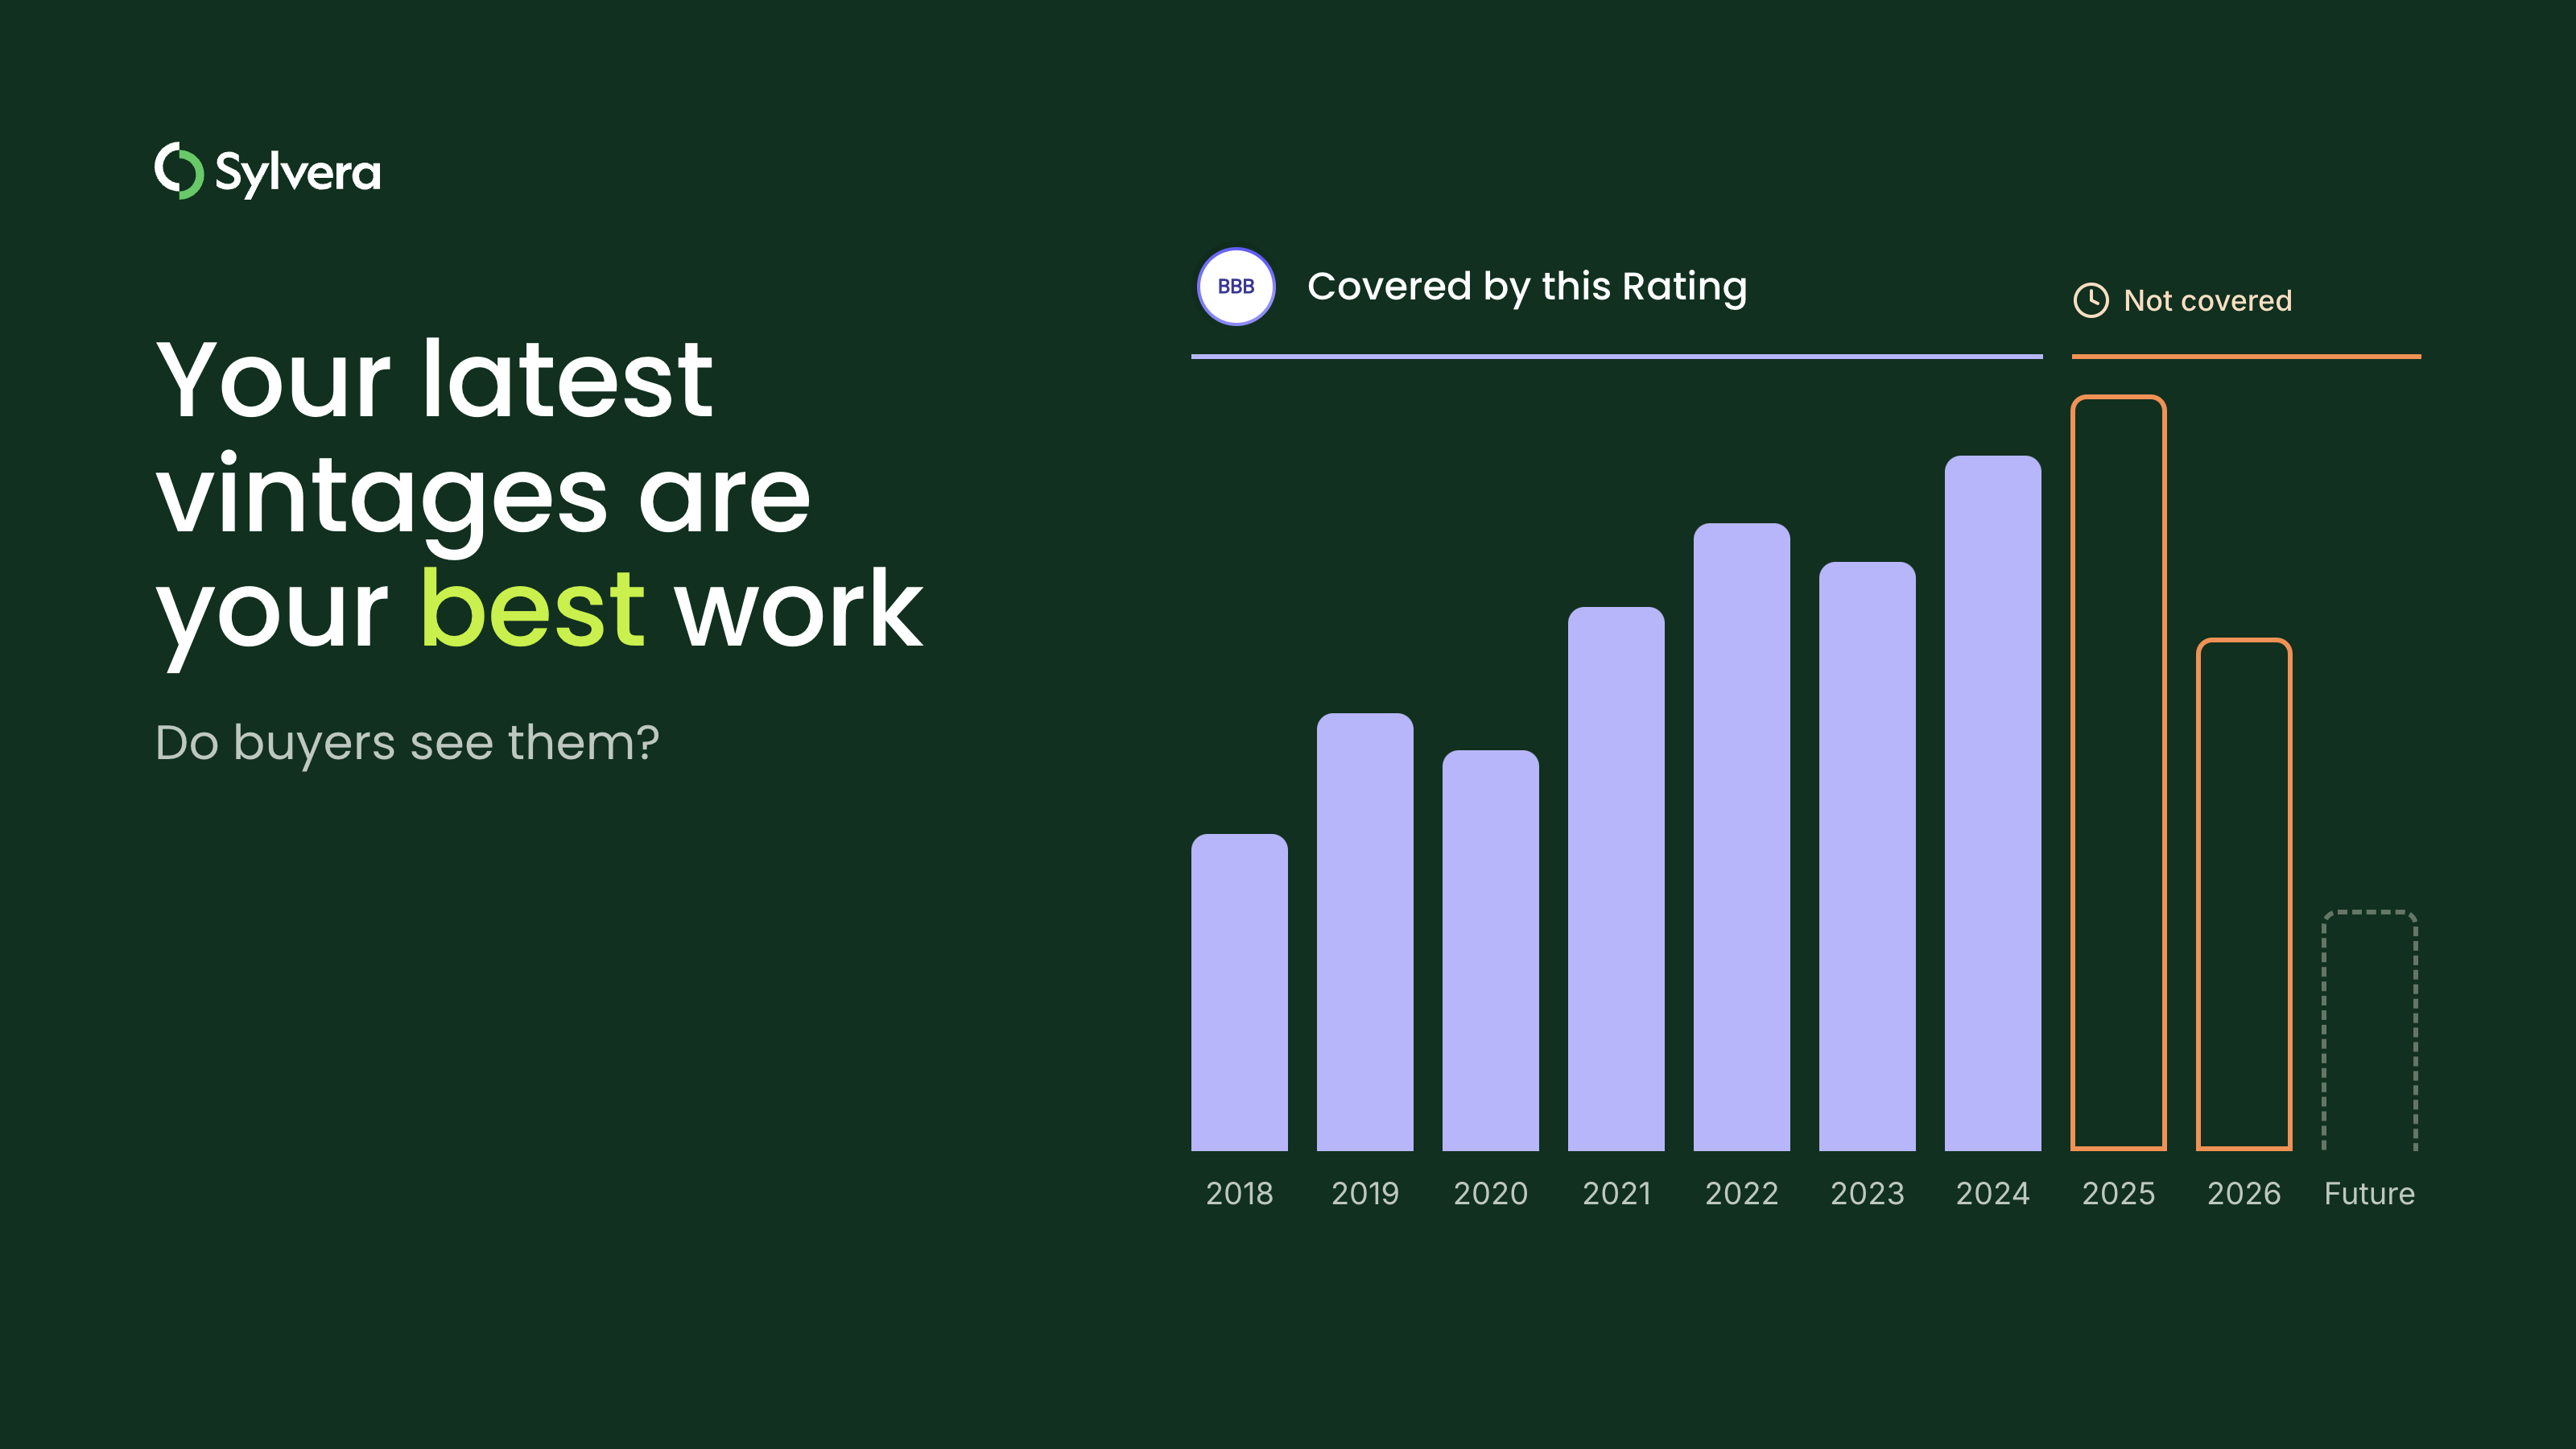


“Over the years we’ve invested significantly in our field data team - focusing on producing trusted ratings. While this ensures the accuracy of our Ratings, it doesn’t allow the scale across the thousands of projects that buyers are considering.”

For more information on carbon credit procurement trends, read our "Key Takeaways for 2025" article. We share five, data-backed tips to improve your procurement strategy.

One more thing: Connect to Supply customers also get access to the rest of Sylvera's tools. That means you can easily see project ratings and evaluate an individual project's strengths, procure quality carbon credits, and even monitor project activity (particularly if you’ve invested at the pre-issuance stage.)
Book a free demo of Sylvera to see our platform's procurement and reporting features in action.
What is a Life Cycle Assessment?
A life cycle assessment (LCA) is a standardized methodology you can use to quantify the environmental impact of a product, process, or service across its entire lifecycle. ISO 14040 describes the principles and framework for LCA, while ISO 14044 defines requirements and provides guidelines for LCA.
.avif)
A proper LCA tracks all inputs, like raw materials, energy, and water, and all outputs, such as emissions, waste, and co-products, at every stage of a product's life cycle. Said stages include raw material extraction, manufacturing, transportation, use, and final disposal or recycling.
The "life cycle" framing is key. An effective LCA includes all stages. As such, it will expose a product that looks clean at the manufacturing stage but carries high upstream emissions from mining or feedstock cultivation, or high downstream emissions from use-phase combustion.
It's important to understand that an LCA can assess multiple environmental impact categories, not only carbon. For example, it can assess water footprint, land use, acidification, eutrophication, resource depletion, and human toxicity, amongst others.
This article focuses specifically on the climate and carbon dimension, which is where most regulatory and commercial activity happens.
What is a Carbon Footprint?
A carbon footprint is the total greenhouse gas emissions caused by a product, organization, event, or activity, expressed in carbon dioxide equivalent (CO2e).
A product carbon footprint (PCF) is the GHG result of a product-level LCA. It captures direct emissions from manufacturing processes, indirect emissions from purchased energy, and other indirect emissions that occur upstream and downstream across the value chain. Put another way, a product carbon footprint is what you get when you complete an LCA focused on the climate change impact category.
.avif)
An organizational carbon footprint tracks a company's total emissions across Scope 1, which are direct emissions, Scope 2, which refers to purchased energy, and Scope 3, which includes all other indirect emissions along the value chain.
Both types depend on LCA-derived data for credibility.
At the end of the day, a carbon footprint is an output. LCA is the process that produces it. A carbon footprint without an LCA methodology to back it up is a number without a verifiable basis.
Life Cycle Assessment vs. Carbon Footprint: What's the Difference?
The difference between the terms "life cycle assessment" and "carbon footprint" is important.
This is especially true when you're evaluating environmental claims, working to meet regulatory requirements, or making procurement decisions based on carbon performance data.
At the most basic level, LCA is the methodology, while a carbon footprint is the result.
Think of it in financial terms: An audit is a process that produces a financial statement. Likewise, an LCA defines what you measure and how. Then, after you measure these things, you get a carbon footprint.
In addition, an LCA has a broader scope than a carbon footprint, as it can assess multiple environmental impact categories simultaneously, like climate change, water use, land use, human health impacts, and more. A carbon footprint only focuses on greenhouse gas emissions.
Both LCA and carbon footprints can have different boundary definitions, too. Examples include cradle-to-gate, cradle-to-grave, or well-to-wheel. The boundary you choose can change the result, which is a key difference that practitioners need to watch for when comparing figures across producers or schemes.
On the standards side, LCA follows ISO 14040 and ISO 14044. Product carbon footprints follow ISO 14067 and the GHG Protocol Product Standard. These frameworks are closely aligned but not identical.
Because of these differences, you shouldn’t take carbon footprint figures at face value. Instead, ask questions like, "What LCA methodology, boundary, and emissions factors did you use to produce this number?" Without the answers, the carbon footprint figure is meaningless.
How a Carbon Life Cycle Assessment Works: The Four Distinct Phases
The ISO 14040 framework structures an LCA into four phases. Once you understand them, you'll know why two products that look similar can produce very different carbon footprints.
.avif)
Phase 1: Goal and Scope Definition
First, define what you need to assess and why.
This phase establishes the "functional unit" as a reference point for all calculations. For fuel, that might be 1 MJ of energy delivered. For cement, it might be 1 tonne produced. For hydrogen, 1 kg of output.
The system boundary is also set. Cradle-to-gate covers extraction through production. Cradle-to-grave extends through end-of-life. Well-to-wheel is common for transport fuels.
This is the single most important decision in the LCA. Two assessments using different boundaries will produce different numbers. Neither is wrong; they're just measuring different things.
Phase 2: Life Cycle Inventory (LCI)
Second, use the inventory analysis phase for data collection.
Every input and output within the boundary gets quantified: Raw materials, energy consumed, transport distances, manufacturing processes emissions, waste streams, and co-products.
Data quality is the biggest practical challenge. Accurate primary data, measured directly at a facility, gives the most reliable inventory. Secondary data from industry averages or databases like ecoinvent fills gaps but introduces uncertainty. For global supply chains, getting good primary data from every node in the chain is difficult, which is why independently verified data is so valuable.
For commodities, the inventory phase is where facility-level differences emerge. Two cement plants using the same clinker chemistry but different fuel mixes, like coal instead of natural gas or fossil fuels instead of alternative fuels, will have different inventories—even before the impact assessment step.
Phase 3: Life Cycle Impact Assessment (LCIA)
Third, convert inventory data into environmental impact scores using characterization factors.
For carbon footprint calculations, you must multiply each greenhouse gas emission by its global warming potential (GWP) to arrive at a CO2e figure and evaluate environmental performance.
GWP100, the 100-year warming horizon, is the standard that most regulatory frameworks use. GWP20, a 20-year horizon, is the process that many methane-heavy processes use because it better reflects methane's near-term warming impact. The choice of GWP timeframe is another methodological variable that can shift results, particularly for processes that involve significant methane leakage.
The output of this phase is the carbon footprint: Total greenhouse gas emissions per functional unit, expressed as gCO2e/MJ for fuels or tCO2e/tonne for materials.
Phase 4: Interpretation
Fourth, analyze the results to identify emissions hotspots, test assumptions, and determine how robust the findings are. Which lifecycle stages contribute the most? Where are the reduction opportunities?
Sensitivity analysis is critical. If the result changes when you alter the electricity grid mix, the transport distance, or the allocation method, the LCA is fragile. Treat any carbon footprint based on it with caution.
Any comparative claim, like "Our product is lower-carbon than theirs," requires independent verification. That way, all parties can ensure the comparison is apples-to-apples.
Why LCA Methodology Choices Matter More Than the Number
Carbon footprint figures can be misleading. The same physical product, made in the same facility, can generate a different carbon footprint depending on the methodological choices made during the LCA.
Boundary selections contribute to the discrepancy. For example, a cradle-to-gate carbon footprint for cement excludes downstream transport and end-use entirely. A cradle-to-grave footprint includes them. Neither is wrong in isolation, but comparing the two produces nonsense.
Allocation methods create similar problems. When a production process yields multiple outputs, like biofuel and animal feed, for instance, or crude oil alongside co-products, the emissions have to be split across those outputs. However, energy allocation, mass allocation, and economic allocation yield different carbon footprints from the same underlying data.
Data quality adds another layer of variability. Using facility-level measured data versus industry-average defaults can shift results by 30–50%. Self-reported data versus independently verified data introduces additional uncertainty that's difficult to quantify without knowing the source.
Geographic and temporal choices also matter. Both annual-average grid emissions versus hourly marginal emissions and regional versus national defaults affect the accuracy of an LCA.
The practical consequence is that different compliance schemes—CBAM, LCFS, RED II, CORSIA, RFNBO—specify their own LCA boundaries, emissions factors, and allocation methods. A producer's carbon footprint looks different under each framework, even when the underlying physical operations are identical. This fragmentation isn't accidental, as each scheme reflects different policy goals. But it creates challenges for producers, buyers, and investors trying to make consistent, informed decisions.
Where LCA and Carbon Footprint Are Used In Practice
LCA underpins emissions measurement and reporting across a range of contexts, enabling businesses to meet compliance requirements, manage supply chain risk, and make credible environmental claims.
In regulatory compliance, CBAM requires importers to report the embedded emissions of covered goods, calculated using LCA methodology. LCFS assigns pathway-specific carbon intensity scores using the CA-GREET model, which is an LCA tool. RED II uses LCA for biofuel sustainability criteria. CORSIA uses LCA to assess eligible fuel pathways. In every case, the underlying methodology is LCA.
In corporate carbon accounting, Scope 3 emissions for purchased goods and services are estimated using LCA-derived product carbon footprints. As regulatory requirements tighten and supply chain transparency becomes part of sustainability performance reporting, accurate LCA inputs are vital.
In procurement, buyers who compare suppliers on carbon need LCA-based carbon footprints to make like-for-like comparisons. Without a consistent methodology behind each supplier's figures, carbon footprint comparisons are unreliable. Environmental labels and product declarations, including Environmental Product Declarations (EPDs) for construction materials and the EU Product Environmental Footprint (PEF), are also LCA-based, which gives buyers a standardized basis for sourcing decisions.
Finally, investors need facility-level LCA data to conduct due diligence on commodity producers. Assessing carbon intensity, monetization potential across schemes, and long-term regulatory exposure all depend on having reliable, independently verified LCA-derived data.
Where Sylvera Stands
Sylvera's Carbon Intensity Assessment is, at its core, a standardized LCA applied at the facility level.
We analyse emissions across the entire life cycle, from raw material inputs through the production process, using a consistent, mechanism-agnostic proprietary framework. Even better, our framework enables direct, like-for-like comparison across facilities, producers, and geographies.
What makes our assessments practically useful is our multi-framework output. Put simply, we calculate carbon intensity under our own standardized framework and under the specific LCA parameters required by individual compliance schemes, like CBAM, LCFS, CORSIA, RFNBO, and others, from one data input.
That way, producers don't need separate LCA exercises for each scheme, and buyers can compare facilities on a consistent basis regardless of which mechanism they deem relevant.
Every assessment includes a confidence score based on data availability and source, so users know how much weight to put behind each figure. This transparency is what distinguishes independent third-party assessment from self-reported carbon footprints, where methodology and data quality are often opaque.
At Sylvera, we also offer Commodity Insights, which provides market-level carbon intensity data across assessed facilities in ammonia, cement, oil, steel, hydrogen, fertiliser, and more. Investors and procurement teams can benchmark suppliers, track where low-carbon supply is emerging, and identify which facilities meet the CI thresholds required by specific schemes. And they can do it using trustworthy LCA-derived data.
The broader principle applies across sustainability initiatives. After all, a carbon footprint is only as credible as the LCA behind it. An independent, rigorously conducted assessment turns a number into action.
Request a demo to see how Sylvera's LCA-based carbon intensity assessments support compliance, procurement, and investment decisions. Or try our Commodity Insights for free here.