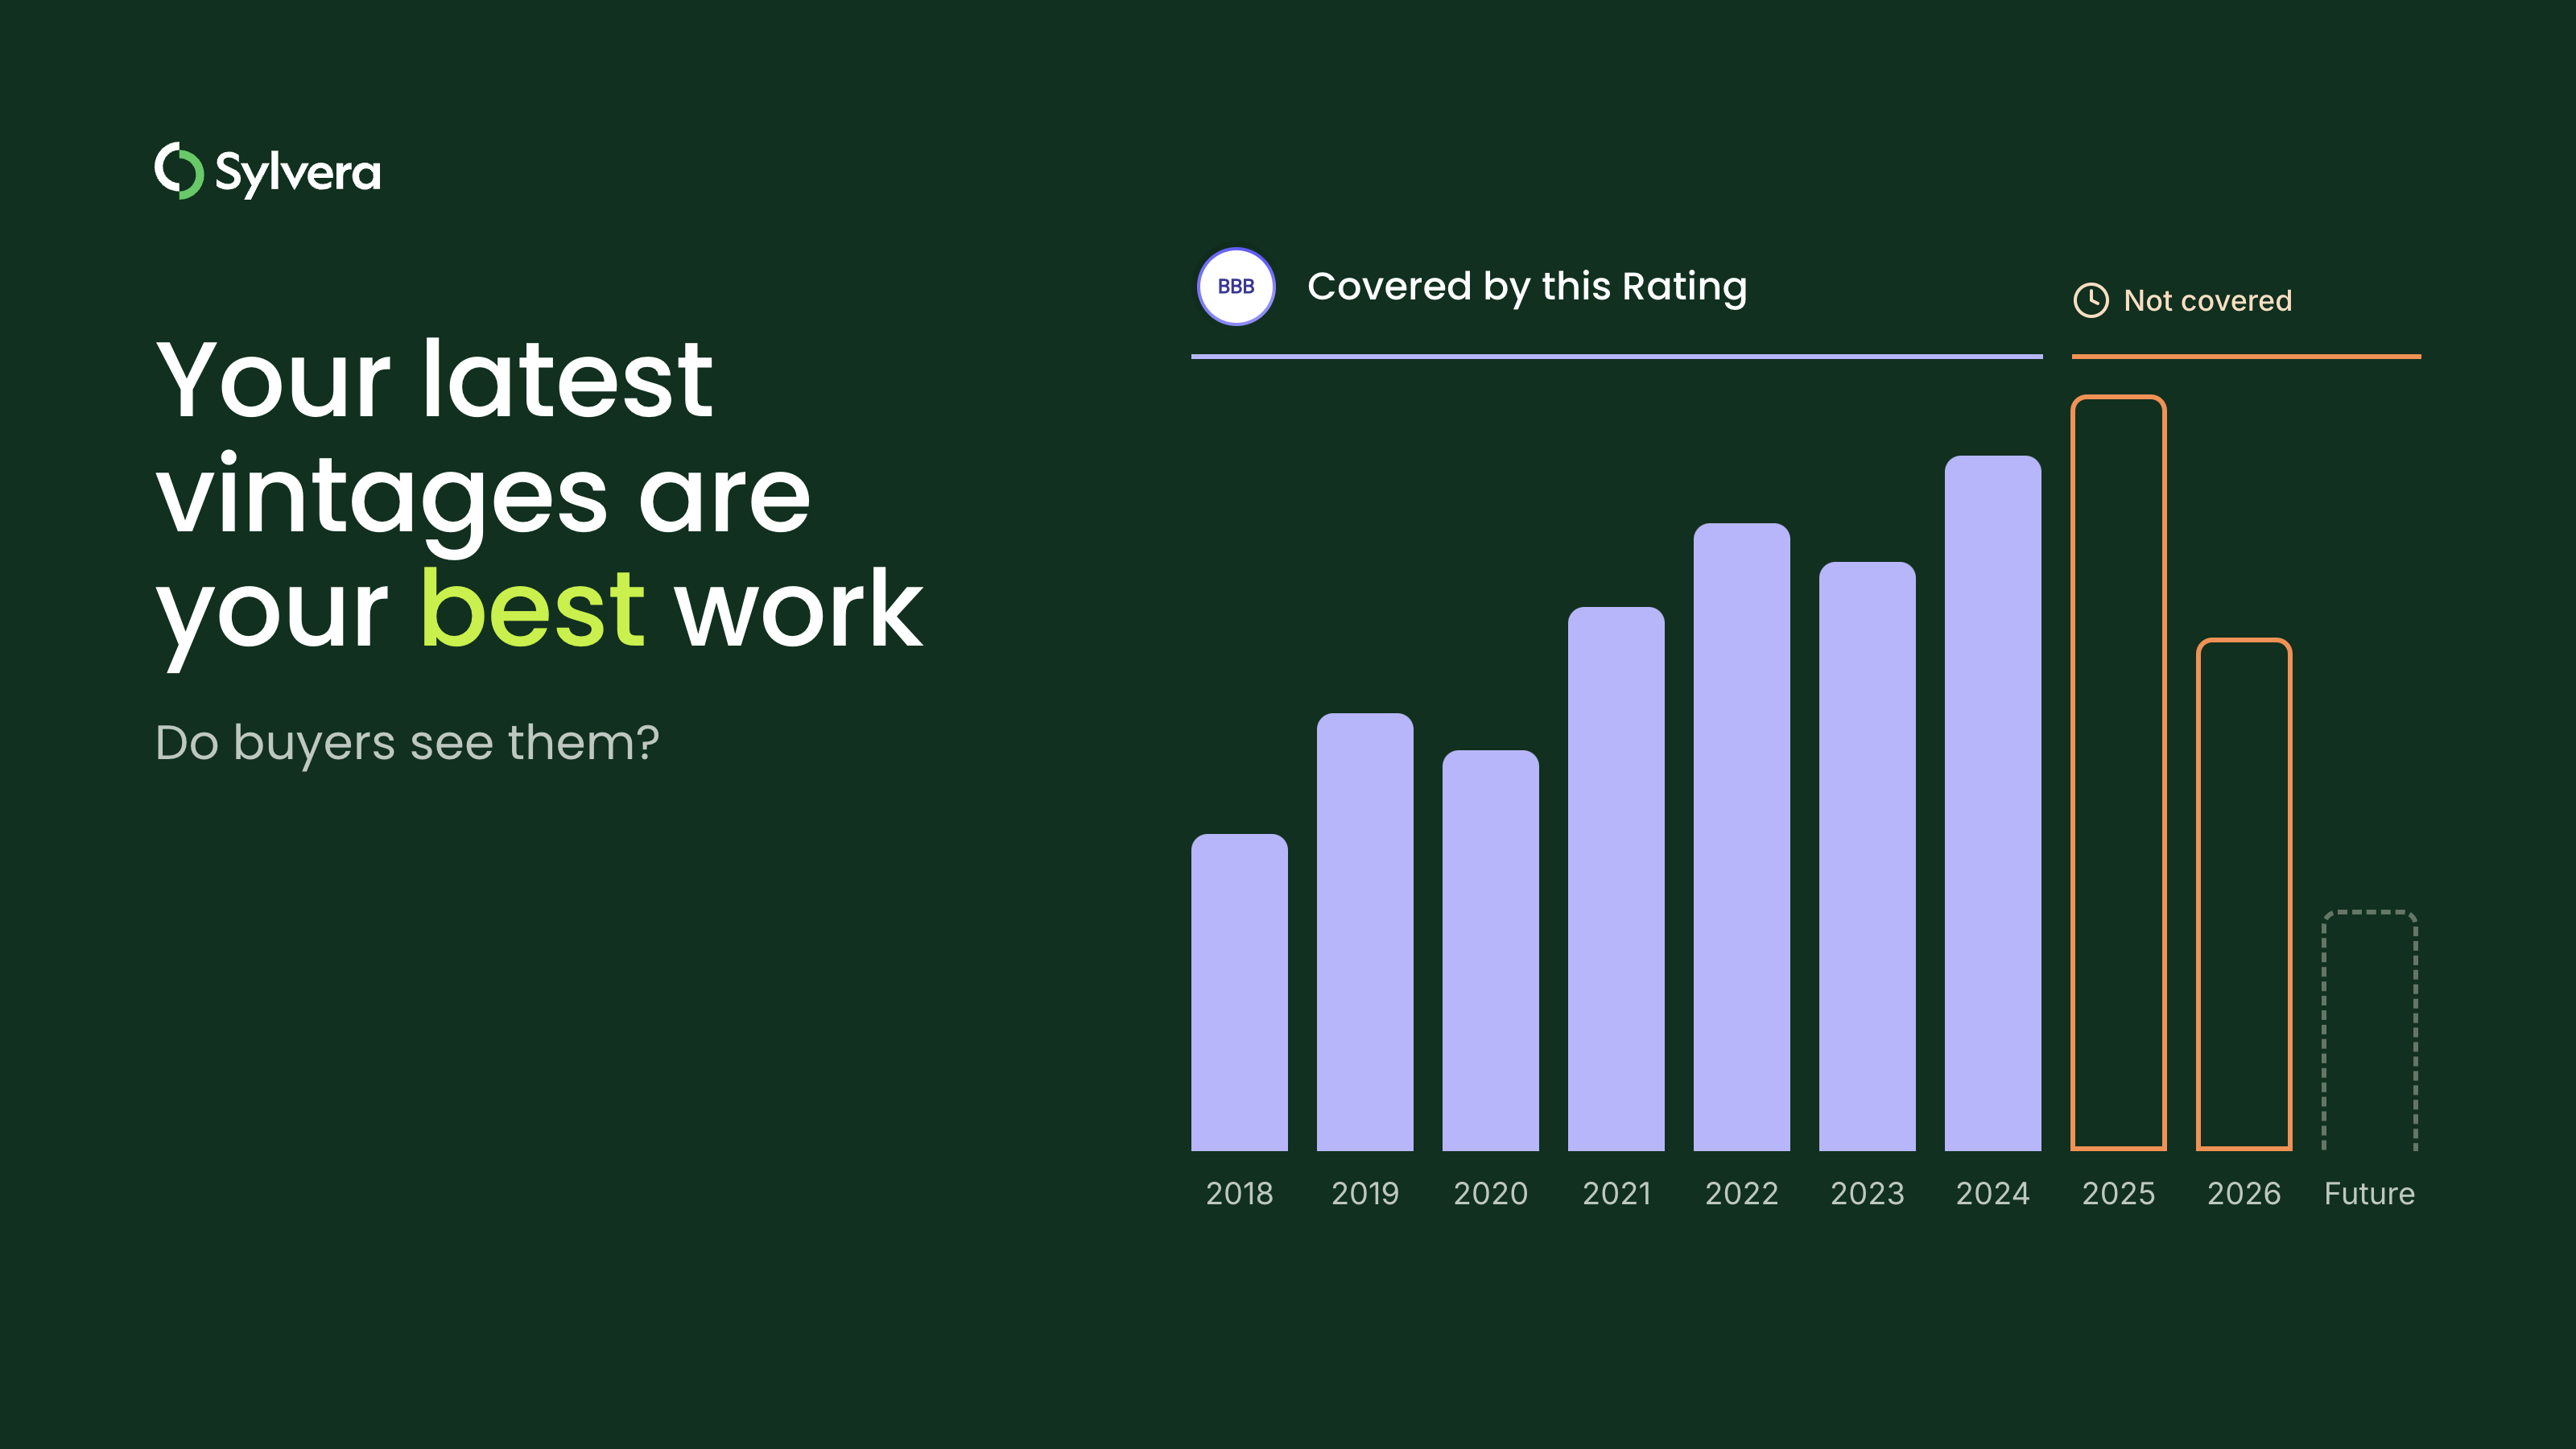
“Over the years we’ve invested significantly in our field data team - focusing on producing trusted ratings. While this ensures the accuracy of our Ratings, it doesn’t allow the scale across the thousands of projects that buyers are considering.”

For more information on carbon credit procurement trends, read our "Key Takeaways for 2025" article. We share five, data-backed tips to improve your procurement strategy.

One more thing: Connect to Supply customers also get access to the rest of Sylvera's tools. That means you can easily see project ratings and evaluate an individual project's strengths, procure quality carbon credits, and even monitor project activity (particularly if you’ve invested at the pre-issuance stage.)
Book a free demo of Sylvera to see our platform's procurement and reporting features in action.
What Is a Life Cycle Assessment?
A life cycle assessment (LCA) is a systematic, standards-based methodology for quantifying the environmental impacts of a product, process, or service across its entire life cycle. It's governed by the international standards ISO 14040 and ISO 14044 , which define the framework.
The term "life cycle" refers to everything from raw material extraction ("cradle") through manufacturing, transport, use, and end-of-life ("grave"). Nothing is excluded unless explicitly scoped out.
It's important to understand that LCA can assess multiple environmental impact categories, including climate, water, human health, human toxicity, and land use. However, in carbon markets, the focus is almost always on greenhouse gas emissions that produce a carbon footprint or carbon intensity score.
To learn how LCA relates to carbon footprint specifically, see our dedicated article.
.avif)
Why LCA Matters Now: From Academic Tool to Market Infrastructure
LCA used to be an academic exercise. Today, it's commercial infrastructure.
CBAM requires LCA-derived embedded emissions for imports. LCFS assigns credit values based on LCA-calculated pathway carbon intensity. CORSIA, RED II, and RFNBO specify LCA requirements for eligible fuels and feedstocks. If you produce, buy, trade, or invest in commodities, LCA methodology determines your compliance costs, credit revenue, and supplier competitiveness.
The catch is that LCA is only as reliable as the choices made within it. Boundary definitions, data sources, and allocation methods can shift a carbon intensity score by 30–50%. Understanding those choices—and how practitioners make them—will make sure you're not misled by raw numbers.
Step 1: Define What You're Measuring and Where the Boundaries Are
Every LCA starts with a scoping decision, which shapes everything downstream. As such, step one in your life cycle analysis assessment is crucial to its success. Here's how to go about it:
Choosing Your Functional Unit
The functional unit is what you're measuring "per," AKA the denominator of your result. Examples include 1 MJ of delivered fuel, 1 tonne of cement, 1 kg of hydrogen, and 1 kWh of grid electricity.
The functional unit you choose is important because it determines comparability. For instance, you can't compare diesel and ethanol on a per-litre basis because they have different energy densities. As such, "per MJ" is the standard for fuels under LCFS and RED II, which will ensure your LCA is useful.
Drawing the System Boundary
Your choice of boundary is the most consequential decision you'll make for your LCA. This is because the boundary defines what's included and excluded. Common boundary types include:
- Cradle-to-Gate: This boundary type covers raw material extraction through production. It's the standard for industrial commodities because CBAM requires it for compliance.
- Cradle-to-Grave: This boundary type covers everything from raw material extraction to end-of-life disposal. It's the conceptual default defined by ISO 14040/14044, and the most complete option. But compliance schemes often mandate narrower boundaries suited to their specific context.
- Well-to-Wheel: This boundary type is for fuels, specifically, and covers extraction through combustion. It's the standard for transportation that operates under LCFS and similar standards.
- Gate-to-Gate: This boundary type is a single process step. It's useful for facility-level hotspot analysis, but it won't help you ensure compliance for your organization.
The same product can look very different under different boundaries. For example, a cement producer's gate-to-gate carbon intensity excludes upstream mining and downstream transport. Their cradle-to-gate carbon intensity, however, includes raw material extraction. At the same time, a biofuel's well-to-pump figure excludes combustion, while its well-to-wheel figure includes it.
As you can see, understanding which boundary applies to your compliance context is essential—at least if you want to produce a credible assessment. Once you know what your boundary is, you can then ask yourself, "What data do I need, and where does it come from?"
Step 2: Build Your Inventory: The Data Challenge
The life cycle inventory analysis (LCI) stage is where the practical work happens. It's also where you ensure the accuracy of your final result. Let's make sure you get this part right:
What the Inventory Captures
The inventory captures every input and output within the boundary: Raw materials; energy consumption by source; water; transport, including distance, mode, and fuel; process emissions; waste; and co-products.
The depth of the data collection phase depends on the product you're evaluating and the boundary you've chosen. For a cement LCA, it captures clinker ratio, fuel mix, regional grid electricity consumption, supplementary cementitious material (SCM) types, transport distances, and waste streams.
For a fuel LCA, it captures feedstock cultivation inputs, like fertilizer, irrigation, and machinery; extraction; refining energy; and, if the boundary includes it, combustion. For an ammonia LCA, it captures production pathways, such as steam methane reforming, electrolysis, or coal-based; hydrogen production energy and source; Haber-Bosch process inputs; and carbon capture rates (where applicable).
When the inventory reflects the technical system, the final carbon intensity score is more accurate.
Primary vs. Secondary Data: The Accuracy Trade-Off
You measure primary data at the specific facility you need to assess. It's the gold standard.
After all, if you know the exact fuel consumption, electricity use, and emissions at Plant A, your LCA will reflect Plant A's actual environmental performance, not a vague estimation or industry average.
Secondary data comes from LCA databases and includes industry averages, regional proxies, and modeled estimates. It fills gaps when primary data is unavailable, such as when estimating upstream extraction processes, energy use across regional electricity grid mixes, and/or transportation workflows.
The mix between primary and secondary data is important. If you use a database average for grid electricity when your facility operates on a specific regional grid, you can swing the result by 30–50%. At the end of the day, using primary data for the processes you control will lead to a more accurate LCA. Because of this, aim to use primary data to determine your organization's environmental footprint.
Step 3: Assess the Impact: Turning Data Into Carbon Numbers
Life cycle impact assessment (LCIA) is Stage 3 of the process, and the point at which inventory data becomes a usable result. If you've ever wondered, "What is life cycle impact assessment?" it's simply the conversion of collected data into standardized impact scores.
LCIA works by applying characterization factors to each emission or resource flow in the inventory. For climate change, every greenhouse gas, like CO2, CH4, N2O, and HFCs, is multiplied by its global warming potential (GWP) and summed to produce a single CO2e figure.
GWP100, which specifies a 100-year time horizon, is the compliance standard for most schemes. GWP20, which specifies a 20-year time horizon, is often used for methane-heavy processes because it captures methane's more acute near-term warming impact.
The result of the LCIA is either a carbon footprint, which is an absolute figure, or a carbon intensity score, which is normalized per functional unit—gCO2e/MJ, tCO2e/tonne.
After completing step three, you have all of the numbers you need. But before you can use them, you need to resolve the most contested question in LCA: How do you handle co-products?
.avif)
Allocation Methods
Most production processes make more than one product.
For example, many biofuel refineries produce fuel, animal feed, and glycerin. Most cement plants produce clinker and waste heat. And oil refineries produce gasoline, diesel, kerosene, and naphtha.
Life cycle assessment allocation methods determine how you divide the environmental burden across those co-products. Just be careful. Your choice of method can shift your carbon intensity scores in a dramatic way.
- Mass Allocation: This method splits impact by the mass of each co-product. It's simple, but easily distorted when co-products have very different values or energy contents. For instance, if 90% of the output mass is a low-value byproduct, the primary product looks artificially clean.
- Energy Allocation: This method splits impact by energy content. It's the standard methodology for fuels under LCFS, and it's more appropriate than mass allocation for energy products. That said, the energy allocation method doesn't reflect the economic reality for most organizations.
- Economic Allocation: This method splits impact by market value. As such, it reflects commercial reality, but also introduces price volatility into environmental results. The same LCA can produce different carbon footprints depending on when you price the co-products.
- System Expansion (Substitution): This method avoids allocation altogether. The boundary expands to include the conventional product your co-product displaces, and the system is credited accordingly. It's methodologically elegant, but its results depend on assumptions about the substituted product. Of note, RED II allows this approach for certain biofuel pathways.
Your allocation methods are important because they each produce different carbon intensity scores.
The same soybean biodiesel pathway can produce a carbon intensity of roughly 40 gCO2e/MJ under energy allocation (LCFS) or roughly 30 gCO2e/MJ under system expansion (RED II). That's a 25% difference from the same physical product, driven entirely by method choice. For a fuel supplier pursuing credits under both schemes, that gap is the difference between compliance and regulatory issues.
Speaking of compliance, different compliance schemes mandate different methods. LCFS requires energy allocation. RED II allows system expansion. CBAM uses direct facility measurement. A producer who operates across multiple mechanisms needs to know how their results shift under each method.
What a Good LCA Looks Like in Practice
The input and output data associated with your LCIA are only as useful as the interpretation you apply to them. In other words, a credible LCA does more than provide a final figure.
- Hotspot Analysis: Your LCA should identify which life cycle assessment stages contribute the most to the total impact. If 70% of a product's carbon footprint comes from one stage, you should focus the bulk of your decarbonization efforts and data quality investments in that area.
- Sensitivity Analysis: Your LCA should also vary key assumptions, like grid mix, transport distance, and allocation method, to check how each impacts the end result. If a 10% change in one parameter shifts the result by 30%, the conclusion is fragile. The study should make that clear.
- Data Quality Assessment: The LCA should clarify how much of the inventory relies on primary facility data versus database estimates, and where the weakest links sit.
- Critical Review: Finally, your LCA should include a critical review, which ISO 14040 requires for comparative claims. If your LCA claims your product is lower-carbon than a competitor's product, it needs independent verification, not only a self-reported review.
.avif)
A Life Cycle Assessment Example: Two Ammonia Pathways
To make the whole process more concrete, consider a simplified comparative LCA with a functional unit of 1 tonne of ammonia, using a cradle-to-gate system boundary:
- Grey Ammonia (Natural Gas Pathway): The inventory covers gas extraction with methane leakage, pipeline transport, steam methane reforming, and Haber-Bosch synthesis. The LCIA converts CO2 from reforming, CH4 leaks, N2O, and electricity inputs into a combined CO2e figure. The result is a carbon intensity score between 1.8 and 2.5 tCO2e/tonne. In addition, the dominant hotspot contributor is reforming, as the process converts fossil feedstock into hydrogen.
- Green Ammonia (Renewable Electrolysis Pathway): The inventory covers renewable electricity generation, water electrolysis for hydrogen, and Haber-Bosch synthesis. There's no fossil feedstock or reforming. As such, the life cycle energy inputs are limited to renewable electricity and the Haber-Bosch process, producing a carbon intensity score of 0.3–0.6 tCO2e/tonne. Plus, the dominant hotspot shifts to the electricity source, which is why the renewable mix matters.
These differences make the carbon-differentiated commodity market possible, and illustrate why comparisons require a standardized methodology. Without comparable facility-level LCA data, a buyer has no reliable way to distinguish between these pathways or verify a producer's claims.
Where Sylvera Stands
Sylvera's Carbon Intensity Assessment is what happens when you take LCA methodology and build it into scalable, decision-grade market infrastructure.
With Sylvera, you get:
- A Proprietary, Mechanism-Agnostic Framework: Sylvera applies a standardized, independent LCA framework at the facility level across lower-carbon commodities, such as hydrogen, ammonia, cement, oil, steel, fertiliser, and more. Every assessment includes a confidence score based on data availability. That way, buyers and producers know exactly how much weight to put behind the numbers.
- Multi-Mechanism Outputs From a Single Data Engagement: Different compliance schemes have different LCA requirements. Sylvera's framework generates carbon intensity scores under our own standardized methodology and specific compliance mechanisms like CBAM, EU ETS, LCFS, etc.—all from a single data input. This enables producers to prove compliance across schemes, while allowing buyers to compare facilities with the appropriate methodology for each context.
- Independent third-party assessment: Sylvera's role mirrors the independent critical review that ISO 14040 requires for comparative claims. Producers control the narrative when they self-report. Our independent, science-led assessment gives buyers and investors a view they can trust, backed by the same rigor that underpins our carbon credit Ratings, only applied to physical commodities.
.avif)
And Sylvera’s Commodity Insights provides market-level carbon intensity data across assessed facilities. So, buyers can compare facilities on a genuine apples-to-apples basis, and producers can prove carbon differentiation with credible third-party evidence, and compliance decisions rest on LCA data that holds up to scrutiny. Put simply, our platform is a win-win scenario for all market participants.
Want to see how Sylvera's LCA-based carbon intensity data supports procurement, compliance, and investment decisions? Request a demo today.
Or try our Commodity Insights for free here.