"A lo largo de los años hemos invertido mucho en nuestro equipo de datos de campo, centrándonos en la elaboración de calificaciones fiables. Si bien esto garantiza la precisión de nuestras valoraciones, no permite la escala a través de los miles de proyectos que los compradores están considerando."

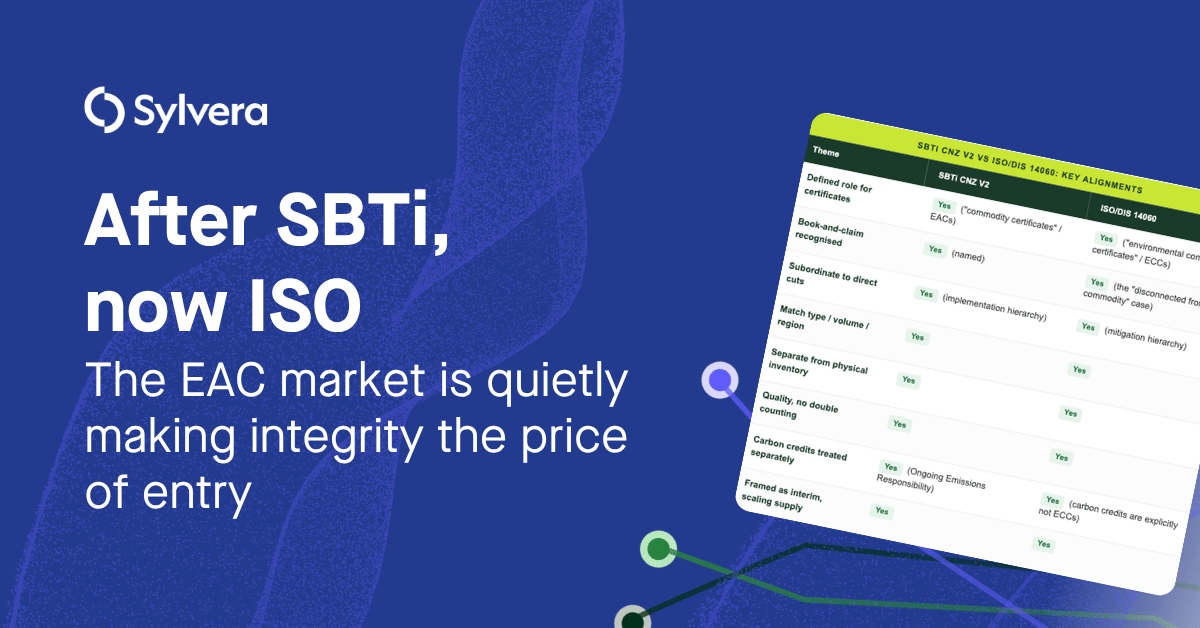
Para más información sobre las tendencias en la adquisición de créditos de carbono, lea nuestro artículo"Key Takeaways for 2025". Compartimos cinco consejos basados en datos para mejorar su estrategia de adquisición.
Una cosa más: los clientes de Connect to Supply también tienen acceso al resto de herramientas de Sylvera. Esto significa que puede ver fácilmente las calificaciones de los proyectos y evaluar los puntos fuertes de cada uno de ellos, obtener créditos de carbono de calidad e incluso supervisar la actividad del proyecto (sobre todo si ha invertido en la fase previa a la emisión).
Reserve una demostración gratuita de Sylvera para ver en acción las funciones de adquisición y elaboración de informes de nuestra plataforma.
Podemos aprender mucho cartografiando la estructura de los bosques. ¿Cuál es la biomasa media de esta especie de árbol en el noreste de Estados Unidos o en Brasil? Y, en consecuencia, ¿cuánto carbono pueden almacenar? Además, ¿qué pueden decirnos los datos sobre el medio ambiente, la fertilidad del suelo y nuestras tácticas generales de gestión forestal? ¿Hay algo que podamos hacer para mejorar la productividad forestal de la región?
Cartografiar la estructura de los bosques es una tarea importante, por lo que muchas entidades diferentes, desde empresas individuales hasta el Servicio Forestal del USDA, se dedican a ella.
¿Qué es la biomasa?
La biomasa puede definirse como la masa seca en pie de materia viva o muerta procedente de plantas leñosas, y suele expresarse como masa por unidad de superficie (por ejemplo, Megagramos por hectárea: Mg ha-1). Es una variable esencial utilizada para controlar el carbono liberado y secuestrado por los ecosistemas de tierras forestales, ya que aproximadamente el 50% de la biomasa es carbono. En este artículo nos referimos a la biomasa aérea, ya que es la única parte que podemos "ver" utilizando la tecnología de teledetección por satélite.
Medición de la biomasa forestal
Medir la biomasa de árboles y arbustos no es fácil. De hecho, la única forma de medir directamente la biomasa es mediante un muestreo destructivo, en el que se talan y pesan los árboles y arbustos.
Este enfoque destructivo es lento, costoso y contraproducente, ya que queremos mantener el carbono en la vegetación en lugar de devolverlo a la atmósfera (lo que probablemente ocurrirá con los árboles talados con el tiempo). Sin embargo, este método es necesario para desarrollar modelos alométricos.
Las alometrías se utilizan para estimar la biomasa a partir de parámetros fáciles de medir, como el diámetro y la altura de los árboles. Se basa en la teoría de la escala biológica y describe las dependencias de los organismos vivos en términos de masa corporal, tamaño y forma.
Los modelos alométricos son utilizados por expertos en ecología forestal y científicos medioambientales en los inventarios forestales tradicionales para calcular la biomasa arbórea. Los inventarios forestales se basan en el establecimiento de parcelas de campo sobre la región de interés para estimar estadísticas forestales de gran superficie. Sin embargo, muchos países tropicales ricos en bosques no llevan a cabo programas de inventarios forestales, o apenas están empezando a ponerlos en práctica, debido a la lejanía de los lugares y a los costes que conllevan.

Al medir la biomasa forestal mediante métodos tradicionales de inventario forestal, estamos expuestos a varias fuentes de error, como las derivadas de la medición manual de las dimensiones de los árboles, las estrategias de muestreo y los modelos alométricos. Las estimaciones alométricas de la biomasa suelen estar sesgadas(Demol et al. 2022), con diferencias del 15%(Burt et al, 2021) o incluso de hasta el 30%(Calders et al, 2015, González de Tanago et al, 2018). Las parcelas de los inventarios forestales se miden durante largos períodos de tiempo (por ejemplo, ciclos de 5 años), utilizando diferentes metodologías, diseños de muestreo, tamaños/formas y operadores, lo que puede dar lugar a grandes discrepancias al evaluar diferentes proyectos y regiones. Además, carecemos de datos de referencia de muchas zonas de los bosques del mundo debido a su inaccesibilidad y/o a su elevado coste. Esto hace que el acceso a datos de referencia de buena calidad sea uno de los principales retos a la hora de supervisar las reservas de biomasa.
Por ello, solemos evitar el término "datos reales" y preferimos el de "datos de referencia". Los datos de referencia son cruciales en la teledetección y la ciencia de datos, ya que para cualquier modelo que desarrolle, siempre se aplica la regla de oro "basura dentro es igual a basura fuera". Por eso, en Sylveraprestamos especial atención a nuestros datos de referencia.
Creación del mejor conjunto de datos de referencia: lidar multiescala para el Atlas de la Biomasa
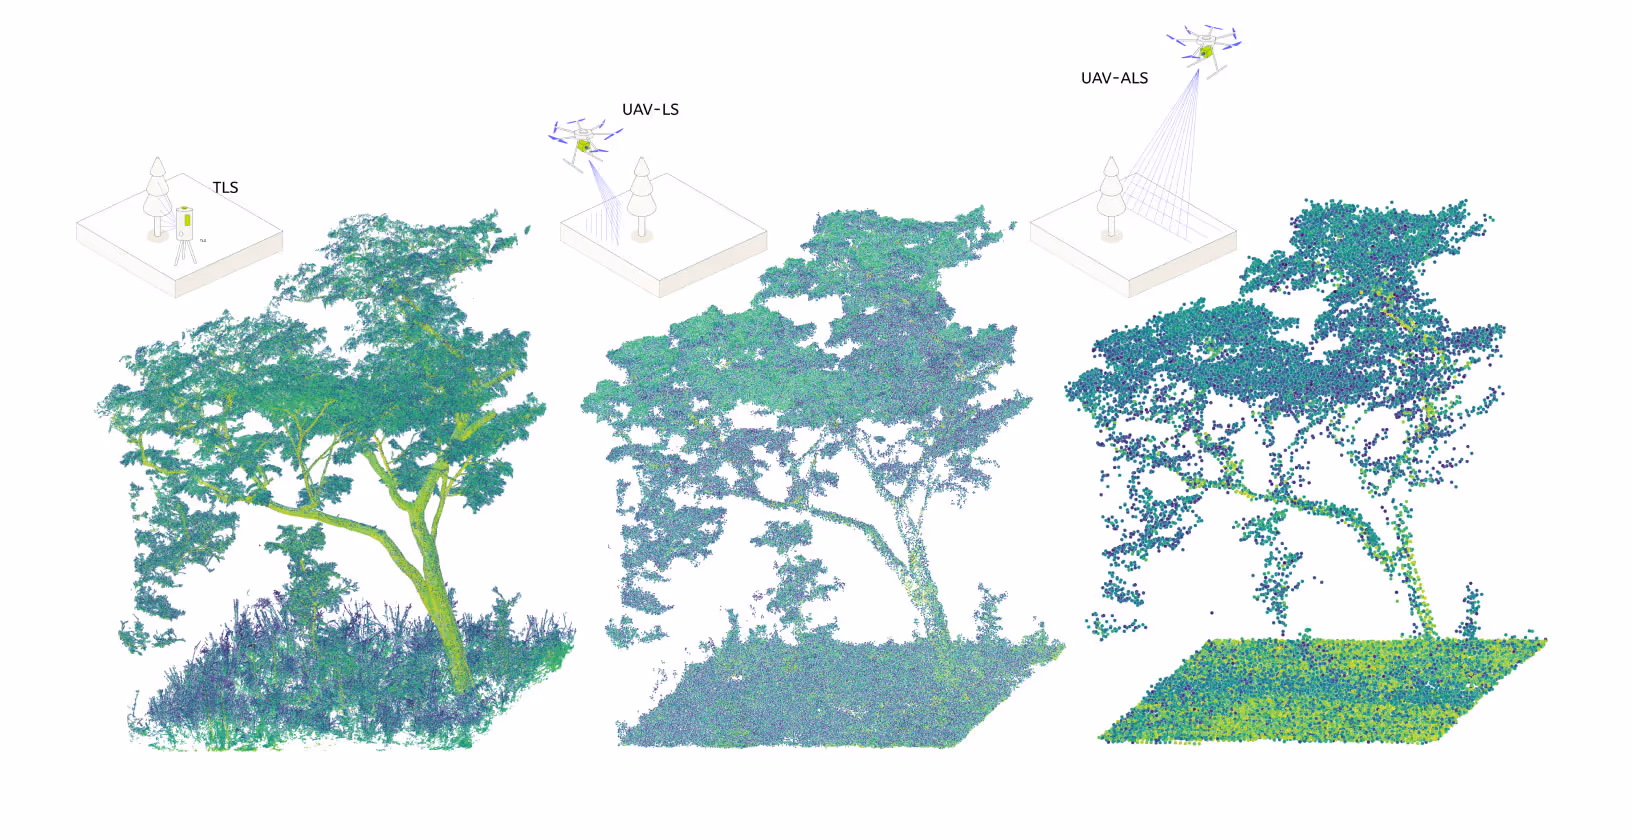
Para ello, visitamos bosques de todo el mundo y los escaneamos con láser desde tierra y aire utilizando nuestros métodos lidar multiescala (MSL ) patentados. Recopilamos datos en 3D (es decir, nubes de puntos) sobre el terreno con nuestros escáneres láser terrestres (TLS). Estos escáneres pueden registrar la estructura de los árboles con una precisión milimétrica, hasta las ramitas y las hojas. También recopilamos datos similares con nuestros escáneres láser aerotransportados (ALS) montados en vehículos aéreos no tripulados (UAV), lo que nos permite recoger datos sobre zonas más extensas.
Este enfoque Lidar multiescala, que combina TLS, escaneado láser UAV y escaneado láser aerotransportado, es la base de Biomass Atlas. Construido sobre la base de más de 10 millones de dólares en campañas de campo propias en más de 250.000 hectáreas en los 5 continentes, representa el conjunto de datos de referencia de biomasa más completo jamás reunido.

Estos nuevos conjuntos de datos contienen grandes cantidades de información sobre la estructura de los bosques y la biomasa aérea. Sin embargo, el acceso a esta información es complejo.
La extracción de datos de árboles individuales nos permite reconstruir y modelizar cuidadosamente parámetros a escala arbórea como la biomasa aérea. Podemos medir la biomasa de los árboles con un margen de error potencialmente tan bajo como el 3%(Burt et al, 2021) en comparación con las mediciones destructivas de los árboles (frente al error de hasta el 30% mencionado anteriormente cuando se utilizan alometrías).
Gracias a esta tecnología MSL, el Atlas de Biomasa es el conjunto de datos de biomasa de referencia más preciso jamás reunido. Podemos escanear hasta 50.000 hectáreas de bosque en una campaña de campo MSL. Los datos de referencia MSL pueden producirse en diferentes resoluciones espaciales, lo que permite una mejor ampliación de los datos utilizando imágenes de satélite. Utilizando los datos de biomasa del MSL también podemos crear nuestra propia calibración de biomasa de huellas LiDAR espaciales adquiridas por el sensor de Investigación de la Dinámica de los Ecosistemas Globales (GEDI), y mejorar nuestro conjunto de datos de referencia.
Estos conjuntos de datos alimentan Biomass Atlas y también nos ayudan a supervisar la salud de los bosques a lo largo del tiempo y a ofrecer calificaciones fiables para todos los proyectos de créditos de carbono basados en la silvicultura.
¿Cómo podemos ampliar nuestras mediciones de biomasa a otros periodos de tiempo y a zonas más extensas?
Nuestra tecnología MSL puede medir la biomasa con una precisión increíble, pero la superficie que podemos cubrir y el número de veces que podemos medir están limitados por el tiempo que podemos dedicar a recopilar datos y el coste de esta actividad (unas decenas de miles de hectáreas por campaña de campo).
La tecnología de teledetección por satélite es crucial para controlar las reservas de biomasa porque nos permite hacerlo con mayor frecuencia (por ejemplo, anualmente), a lo largo de periodos de tiempo más largos (por ejemplo, desde 2000 hasta la actualidad) y en escalas espaciales mayores (por ejemplo, jurisdicciones regionales/nacionales) en comparación con los inventarios forestales.
Las normas actuales de contabilidad del carbono se basan en el uso de imágenes por satélite para detectar actividades dentro de los proyectos de compensación de carbono (por ejemplo, deforestación, nuevas plantaciones forestales) y combinarlas con valores medios de biomasa o factores de emisión de carbono para determinar la cantidad de carbono que almacenan los bosques y la cantidad de carbono que libera cada actividad. Estos valores medios se calculan a nivel de proyecto cada 5-10 años y se basan en mediciones manuales de parcelas de campo.
Desgraciadamente, el periodo entre mediciones es tan largo que puede pasarse por alto una gran cantidad de cambios debidos a alteraciones forestales (es decir, emisiones). La mayoría de las veces, este tipo de trabajo presenta importantes deficiencias de muestreo (por ejemplo, muy pocas muestras) debido al coste, la intensidad de la mano de obra y la inaccesibilidad de algunas zonas remotas. Además, los valores medios son un descriptor cada vez más pobre a medida que aumenta la varianza (especialmente en relación con las deficiencias de muestreo antes mencionadas), y la mayoría de los bosques que nos interesan presentan muchas varianzas estructurales, que pueden afectar a la estimación de las reservas de biomasa y las emisiones de carbono.
Las parcelas de los inventarios forestales nunca se diseñaron para ser utilizadas en combinación con píxeles procedentes de observaciones por satélite. Los datos recogidos manualmente sobre el terreno pueden diferir enormemente de las mediciones remotas por satélite en términos de resolución espacial y cobertura. Por lo tanto, se suelen introducir discrepancias cuando se intenta generar productos derivados de la teledetección de pared a pared.
Atlas de biomasa resuelve estos problemas entrenando los modelos utilizando nuestros conjuntos de datos de referencia basados en MSL de última generación y nuestros datos GEDI calibrados internamente con las mejores imágenes de satélite disponibles públicamente. Este enfoque nos permite eliminar o minimizar estas discrepancias al entrenar nuestros modelos.
Ampliamos nuestras estimaciones de biomasa a grandes áreas y escalas temporales utilizando un radar de apertura sintética (SAR) de longitud de onda larga. Esta tecnología puede "ver" a través de las nubes y tiene una alta sensibilidad a la biomasa, y las imágenes ópticas multiespectrales de satélite que, a pesar de tener menos sensibilidad a la biomasa, tienen una cobertura temporal más larga y contienen otra información útil relacionada con el contenido de clorofila de la vegetación. También utilizamos otra información, como modelos digitales del terreno y análisis de texturas espaciales.

Los bosques son sistemas ecológicos muy diversos que muestran un comportamiento complejo en diferentes escalas temporales y espaciales. Por lo tanto, los algoritmos de aprendizaje automático no paramétricos, que hacen menos suposiciones sobre la forma y la distribución de los datos de referencia, suelen superar a los métodos paramétricos(Evans et al, 2009). Los modelos de aprendizaje automático pueden utilizarse para estimar la cantidad y la distribución espacial de la biomasa y su incertidumbre. Con estos métodos también podemos estimar otros parámetros estructurales del bosque, como la altura del dosel o la fracción de cubierta arbórea.

El Atlas de Biomasa utiliza enfoques de vanguardia revisados por pares para el seguimiento de la biomasa aérea( Rodriguez-Veiga etal, 2020, Meyer et al, 2019, Rodriguez-Veiga et al, 2019). También realizamos validaciones estadísticamente rigurosas y análisis de incertidumbre, y seguimos las mejores prácticas(Duncanson et al, 2021McRobertset al, 2022). Nuestros modelos están entrenados regionalmente para estimar de forma rutinaria y robusta series temporales de biomasa forestal sobre el suelo y reservas de carbono a partir de datos satelitales.
El resultado es una oferta de productos que ofrece:
- Densidad de biomasa por encima del suelo y altura del dosel con una resolución de 30 m para cualquier lugar del mundo
- Cobertura temporal completa desde 2000 hasta la actualidad con actualizaciones anuales (trimestrales a partir del primer trimestre de 2026)
- Estimaciones de incertidumbre para cada píxel
- Errores inferiores al 9% a la escala típica de un proyecto pequeño (400-7.000 hectáreas)
- Entrega rápida de API: datos en horas o días, no en meses
- Cobertura global de pared a pared en todas las regiones boscosas.
Nuestros métodos mejoran constantemente gracias a la adquisición continua de datos MSL para aumentar nuestra cobertura, a la preparación de las próximas misiones por satélite (por ejemplo, la misión NiSAR y Biomass) y a la incorporación de las últimas innovaciones procedentes de nuestra propia investigación y de la literatura científica. Nuestras metodologías son revisadas interna y externamente por destacados académicos en la materia. También hemos colaborado con equipos de investigación de la UCLA, la Universidad de Leicester y el University College de Londres.
¿Por qué es necesario controlar la biomasa leñosa en Sylvera?
En Sylvera calificamos los proyectos de carbono que pertenecen a marcos de carbono como la Reducción de Emisiones por Deforestación y Degradación de los bosques. Dos de los componentes más importantes de estos proyectos son los datos de actividad y los factores de emisión, que luego se utilizan para calcular las emisiones.
Los datos de actividad pueden evaluarse utilizando técnicas de clasificación de la cubierta terrestre en imágenes de satélite, mientras que los factores de emisión pueden evaluarse utilizando nuestras propias mediciones de biomasa. Alternativamente, podemos comparar las emisiones notificadas por los proyectos con nuestras propias estimaciones derivadas de datos de series temporales de biomasa.
Biomass Atlas proporciona estos productos de series temporales de biomasa que permiten conocer mejor dónde y cuánto carbono está cambiando en las distintas zonas del proyecto, y ofrecen la oportunidad de detectar y evaluar las emisiones de carbono derivadas de la degradación forestal (la segunda "D" de REDD+).
Cuando un bosque está degradado sigue existiendo, pero ha sufrido una reducción de su capacidad para producir servicios ecosistémicos como el almacenamiento de carbono. Esto es de vital importancia porque una gran proporción de las emisiones de carbono puede tener su origen en la degradación de los bosques, que en muchos casos no se notifica, y al mismo tiempo, puede ser el trampolín hacia un proceso de deforestación.
El seguimiento de la biomasa por satélite nos permitirá mejorar nuestras calificaciones evaluando las emisiones derivadas de la deforestación y la degradación forestal notificadas por los proyectos, pero también las emisiones originadas por la degradación forestal en los proyectos que no la notificaron.
Además de alimentar las clasificaciones de Sylvera, Biomass Atlas está disponible como producto independiente para todos los participantes en el mercado (promotores de proyectos, registros, gobiernos e inversores) que necesiten datos de biomasa precisos y defendibles para sus propias necesidades de verificación, supervisión o diligencia debida.
Acerca de los investigadores de Sylvera
Los investigadores centrados en la biomasa en Sylvera forman parte de dos equipos: el equipo MSL, responsable de la adquisición y procesamiento de datos MSL, y el equipo de Aprendizaje Automático (ML), encargado de desarrollar métodos para ampliar las mediciones de biomasa a nivel de proyecto y regional utilizando tecnología ML.
La dirección del equipo de investigación incluye:
El Dr. Miro Demol es un científico de MSL Lidar que investiga las aplicaciones del escaneado láser en la silvicultura, con especial interés en la estimación de la biomasa aérea y su incertidumbre.
El Dr. Andrew Burt es un científico especializado en teledetección y ecología forestal tropical del equipo MSL, que durante la última década ha contribuido a ser pionero en el uso del escaneado láser en los bosques.
El Dr. Pedro Rodríguez-Veiga es investigador principal de observación de la Tierra en el equipo de ML y cuenta con más de 12 años de experiencia en el campo de la silvicultura, la recuperación de biomasa aérea mediante teledetección y la vigilancia forestal.
Una mejor gestión forestal puede ayudar a mitigar el cambio climático
No podemos ayudarle con los residuos urbanos de madera. Pero si desea disponer de las estimaciones de biomasa forestal más precisas, ya sea porque es un propietario forestal que intenta producir créditos de carbono o una empresa que desea comprarlos, necesita acceder a la investigación en profundidad y a los conjuntos de datos de Sylvera.
El Atlas de Biomasa, construido sobre la base de más de 10 millones de dólares en campañas de campo LiDAR multiescala de su propiedad, utiliza un enfoque propio con tecnología LiDAR para medir la biomasa sobre el suelo, lo que ha dado lugar a errores inferiores al 9% a escala de proyecto, una precisión muy superior a la que pueden proporcionar los modelos alométricos.
Tanto si eres:
- Un promotor de proyectos que desee obtener financiación más rápidamente con una validación de referencia independiente
- Una infraestructura de verificación de la construcción de registros con capacidad de supervisión continua
- Un gobierno que establezca líneas de base creíbles para los programas REDD+ o del Artículo 6
- Un inversor lleva a cabo la diligencia debida sobre las reservas de carbono
Biomass Atlas proporciona datos precisos de biomasa suministrados por API (disponibles en horas, no en meses) que transforman la medición del carbono y la evaluación de proyectos.
Solicite acceso al Atlas de la biomasa para obtener más información sobre cómo los datos de biomasa más precisos del mundo, basados en LiDAR multiescala y suministrados a través de API, pueden apoyar su estrategia de carbono.