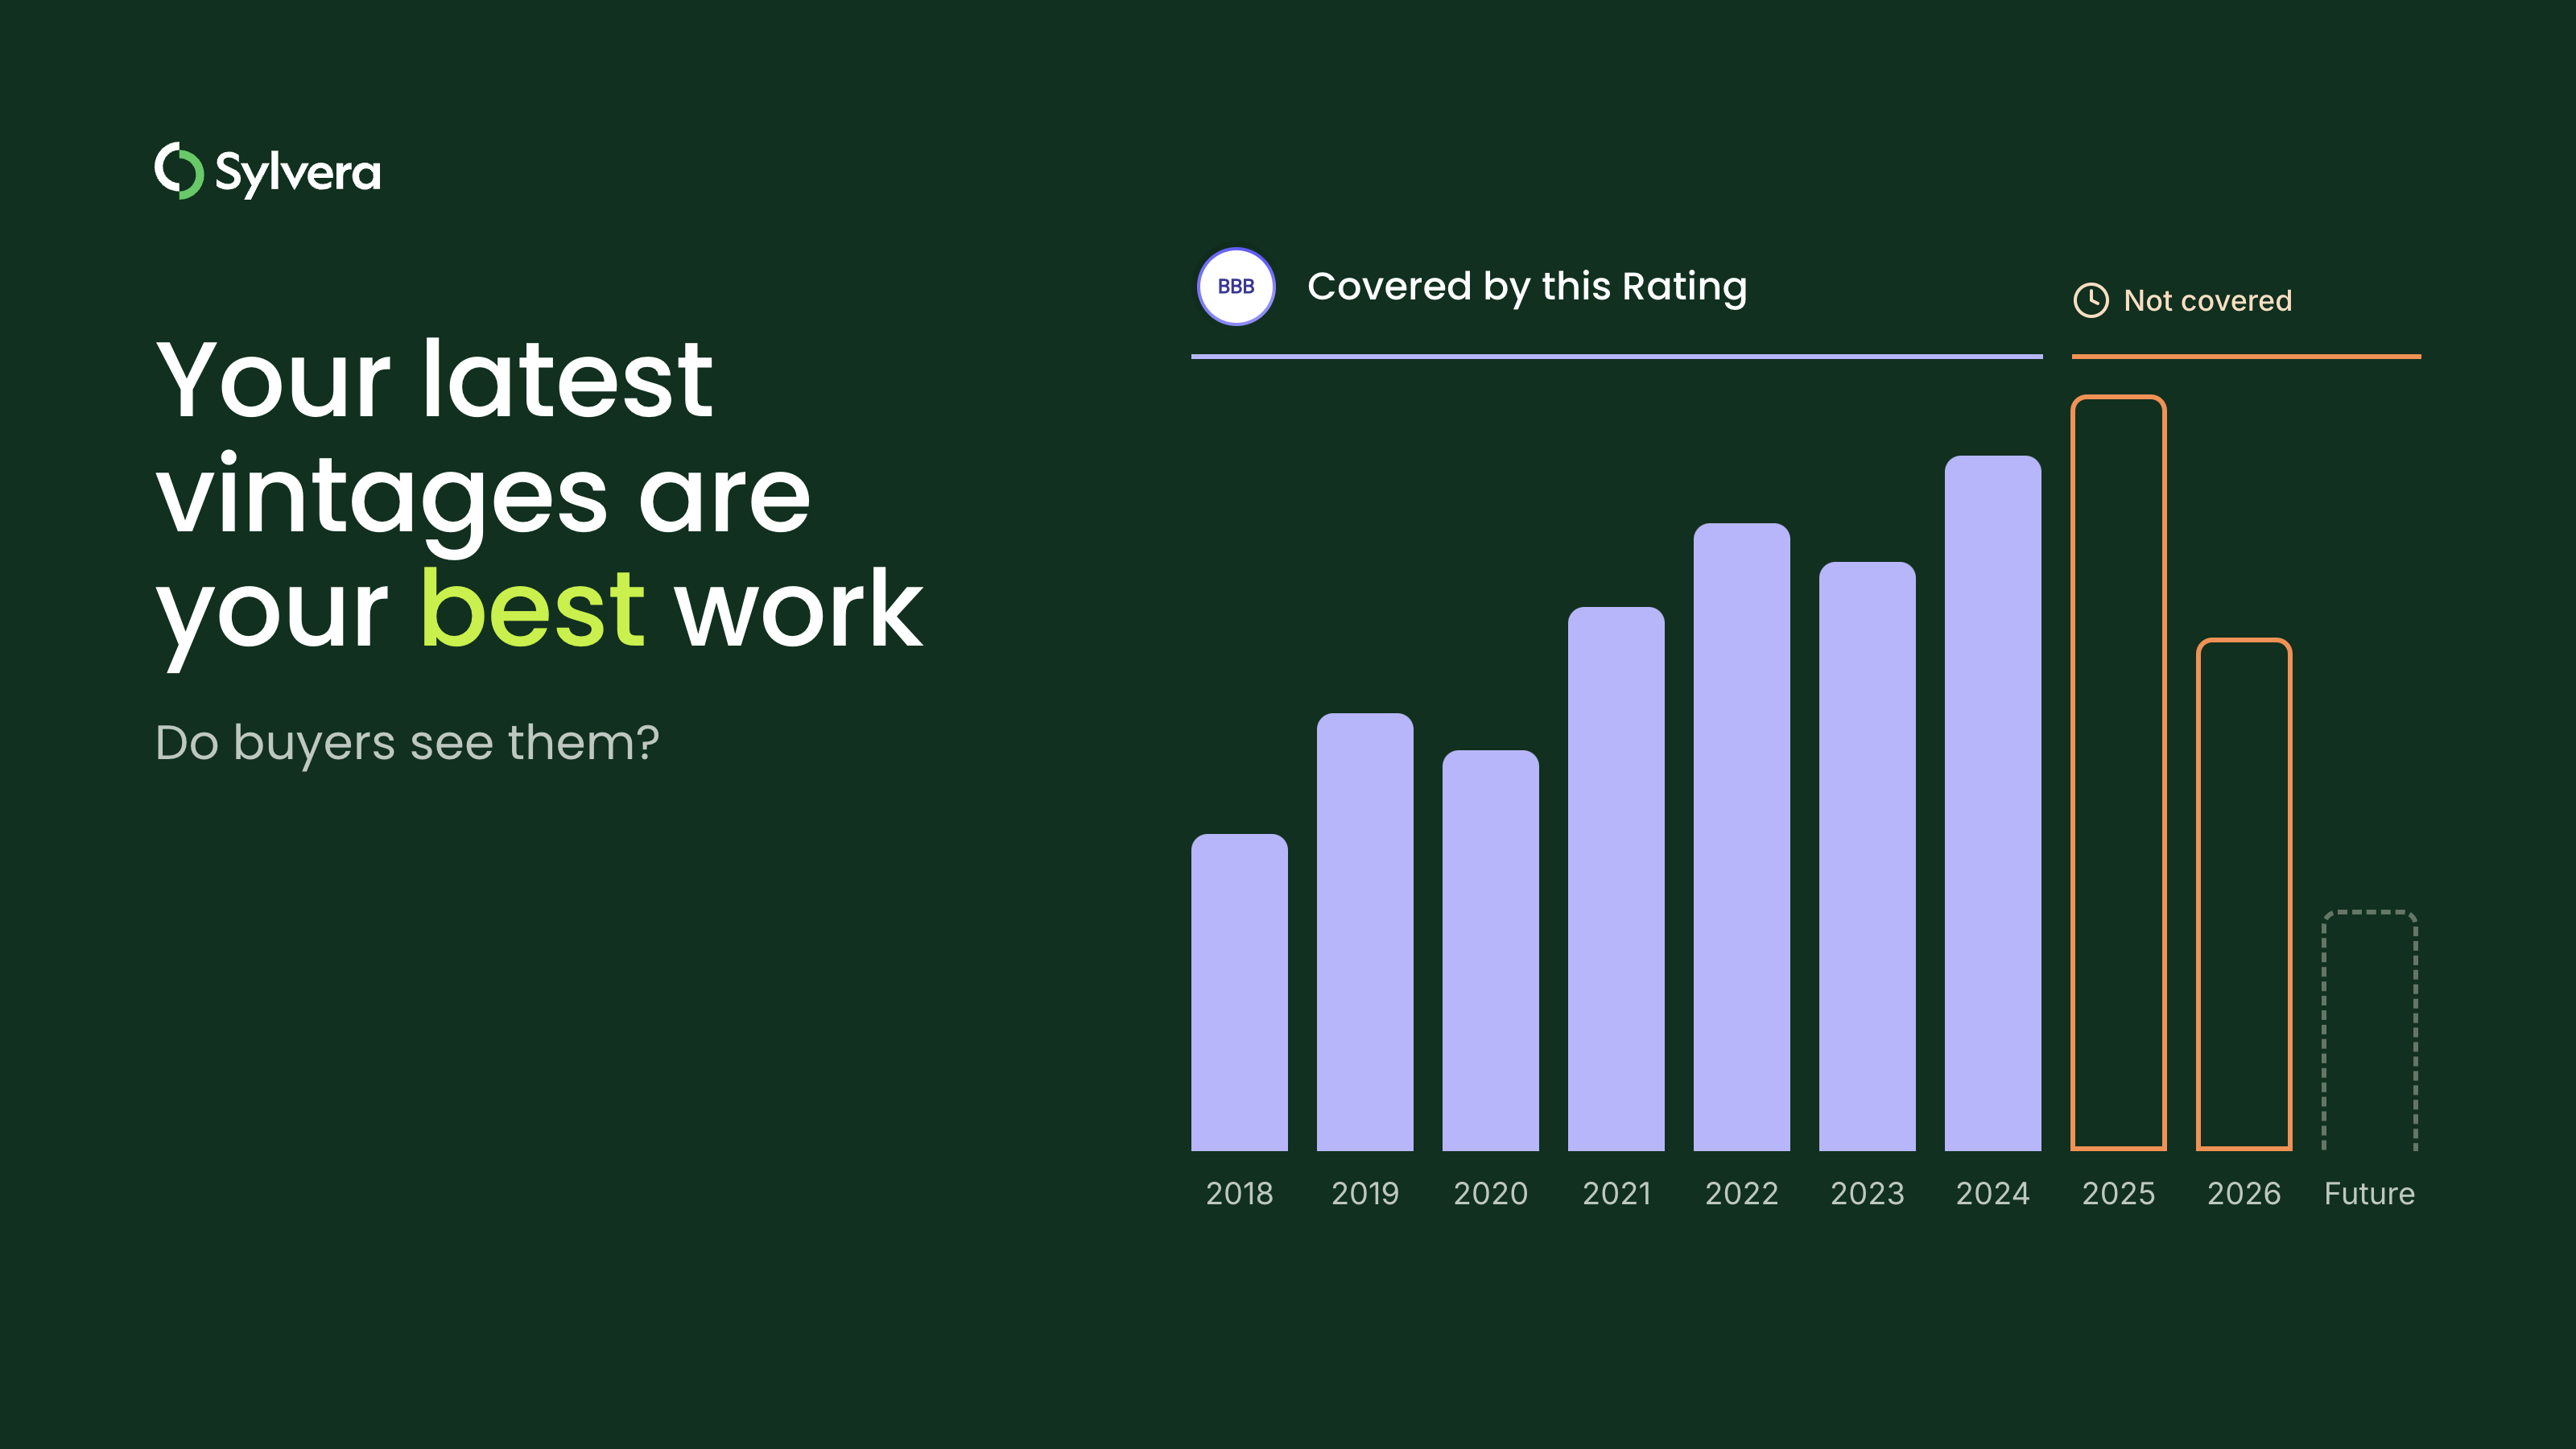
“Over the years we’ve invested significantly in our field data team - focusing on producing trusted ratings. While this ensures the accuracy of our Ratings, it doesn’t allow the scale across the thousands of projects that buyers are considering.”

For more information on carbon credit procurement trends, read our "Key Takeaways for 2025" article. We share five, data-backed tips to improve your procurement strategy.
One more thing: Connect to Supply customers also get access to the rest of Sylvera's tools. That means you can easily see project ratings and evaluate an individual project's strengths, procure quality carbon credits, and even monitor project activity (particularly if you’ve invested at the pre-issuance stage.)
Book a free demo of Sylvera to see our platform's procurement and reporting features in action.
The 50–80% Claim: What Does Sustainable Aviation Fuel Carbon Emissions Reduction Mean?
Airlines and sustainable aviation fuel (SAF) producers cite the "50–80% lifecycle emissions reduction compared to traditional jet fuel" claim on a near constant basis. While the number is real, it needs context.
The figure comes from life cycle analysis (LCA), which compares the cradle-to-wake carbon intensity of SAF against a conventional jet fuel baseline of roughly 89 gCO₂e/MJ under CORSIA's framework.
What most people miss is that "50-80%" is a range, not a single answer. A used cooking oil HEFA pathway can achieve around 80% reduction. A crop-based pathway that factors in indirect land-use change might land at 30–50%. A power-to-liquid (PtL) pathway using renewable electricity could theoretically exceed 90%, or fall below 50% if the electricity grid still carries a large fossil fuel share.
.avif)
At the end of the day, the reduction percentage is the output of a lifecycle calculation, not an inherent property of the fuel. Change the feedstock or energy source, or shift the accounting boundary, and the number changes. Knowing what drives the change is key for aviation compliance teams and fuel buyers.
One more thing: When SAF burns, it releases carbon dioxide at the tailpipe, just like fossil jet fuel. The "reduction" is a lifecycle accounting argument. For biogenic SAF, the carbon in the feedstock was absorbed from the atmosphere during growth, so the net impact is lower across the full supply chain. For synthetic fuels made via power-to-liquid, the carbon is captured from the atmosphere or an industrial source before it's converted into fuel. Neither claim applies to the combustion event itself.
How SAF Lifecycle Emissions Are Measured
To evaluate any SAF pathway's climate benefit, you need to understand the methodology. What emissions are counted, at which stages, and against what baseline? Here's how to tell:
The Lifecycle Boundary
SAF lifecycle analysis uses a well-to-wake (WtWa) boundary, the aviation equivalent of well-to-wheel. As such, it covers every stage of the process: Feedstock cultivation or collection, feedstock transport, fuel production/refining, fuel distribution, and combustion in the aircraft engine.
Some frameworks also include indirect emissions from land-use change. If a biofuel feedstock displaces food crops, food production has to happen somewhere else, potentially on newly cleared land. These secondary emissions are estimated using indirect land-use change (iLUC) models, and they're one of the most contested factors in SAF lifecycle accounting.
The baseline matters too. CORSIA uses ~89 gCO₂e/MJ as the conventional fuel reference. The EU's RED II uses a slightly different figure. Fortunately, the reduction percentage is easy to calculate: Subtract the SAF's lifecycle carbon intensity from the baseline, divide by the baseline, and express as a percentage.
The formula looks like this: (Baseline CI – SAF CI) ÷ Baseline CI = Reduction Percentage.
Lifecycle Stages and What Drives Emissions at Each
Each stage of the lifecycle contributes differently to the final carbon intensity number.
.avif)
- Feedstock Production: This is the biggest source of variation. For crop-based SAF using soybean oil or other vegetable oils, this stage carries cultivation inputs (fertiliser, irrigation, machinery), land management emissions, and direct land-use change. For waste-based SAF, such as waste oils like used cooking oil (UCO), animal fats, or agricultural waste, the feedstock stage is minimal. There's no cultivation burden because the feedstock already exists as a byproduct of something else.
- Feedstock Transport: This factor includes the distance and methodology from the collection point to the refinery. It's usually minor, contributing less than 5% of lifecycle carbon intensity. Though it can matter for feedstocks that you source globally.
- Fuel Production: This is where SAF production technologies diverge. These days, HEFA (hydroprocessed esters and fatty acids) is the dominant commercial pathway. Fischer-Tropsch (FT) synthesis, alcohol-to-jet (AtJ), and power-to-liquid (PtL) each have different energy demands and conversion efficiencies, which affect their lifecycle carbon intensity.
- Distribution: This accounts for transport from the refinery to the airport. It's usually a minor contributor.
- Combustion: All SAF types release CO2 when burned. For biogenic SAF, lifecycle accounting treats net combustion emissions as zero or near-zero because the carbon in the feedstock was previously absorbed from the atmosphere. For synthetic SAF (PtL), the carbon was captured from the atmosphere or from an industrial source during global SAF production.
SAF Pathways and Their Emissions Reduction Percentages
Each major production pathway produces a different range of lifecycle emissions reductions. The pathway you choose determines whether a fuel qualifies for compliance schemes at all.
HEFA — Hydroprocessed Esters and Fatty Acids
HEFA represents about 95% of global SAF production. It hydroprocesses fats and oils into a drop-in fuel compatible with existing aircraft and airport infrastructure without modifications.
That said, reduction percentages depend almost entirely on the feedstock:
- Used Cooking Oil (UCO): This feedstock leads to a 70–85% reduction because it doesn't produce cultivation emissions or land-use change burden. It's the cleanest commercial HEFA pathway.
- Animal Fats / Tallow: This feedstock leads to a 60–80% reduction. It's waste-derived, so the logic is similar to UCO. It's a strong option in terms of commercial HEFA pathways.
- Soybean Oil / Canola Oil: This feedstock leads to a 40–60% reduction before iLUC factors. But those figures can fall to 20–40% with iLUC. As such, it's not the best feedstock.
- Palm Oil: This feedstock is highly variable and often excluded. If production involves deforestation or peatland conversion, lifecycle emissions can exceed those of conventional fuel.
Feedstock choice is the dominant variable in HEFA, and it's why marketing claims about "SAF" without feedstock specifics tell you very little.
Fischer-Tropsch (FT) / Gasification
FT pathways gasify solid feedstocks, like municipal solid waste, agricultural residues, and forestry waste, into syngas, then synthesize it into jet fuel. Waste biomass FT can achieve 70–90% reduction with low feedstock emissions, and potentially negative carbon intensity if the biomass is truly waste-derived.
Fossil-based FT with carbon capture and storage sits in a different category. Some frameworks don't recognize it as SAF at all. However, it can still help you reach net-zero carbon emissions.
Alcohol-to-Jet (AtJ)
AtJ converts ethanol or isobutanol into jet fuel.
The lifecycle reduction relies on the alcohol source. Sugar cane ethanol achieves higher reductions than corn ethanol. The typical range is 50–80%, depending on the source and process energy.
Power-to-Liquid (PtL) / E-Fuels
PtL uses green hydrogen produced via electrolysis from renewable electricity, combines it with CO2 from direct air capture or industrial sources, and synthesizes it into jet fuel via FT or methanol-to-jet routes.
The theoretical greenhouse gas emissions reduction reaches 85–95%+ when the electricity used throughout the pathway is fully renewable, and CO2 comes from direct air capture. If the electricity grid still carries a meaningful fossil share, however, the lifecycle reduction can drop below 50%.
PtL is currently the most expensive pathway and remains below commercial scale, but EU ReFuelEU mandates include a sub-mandate for synthetic SAF starting at 1.2% from 2030. This will likely push SAF deployment in this direction, as aviation fuel demands cater to regulations.
Why Sustainable Aviation Fuel Emissions Reduction Percentages Vary So Much
Two companies can produce SAF with the same production equipment, but the SAF produced can have very different sustainable aviation fuel lifecycle emissions reduction percentages.
Beyond feedstock differences, this is because:
- Indirect Land-Use Change (iLUC): By including iLUC, you can reduce a pathway's claimed reduction by 20–30%. CORSIA includes iLUC for most crop-based feedstocks, but others don't. This creates material differences in how the same fuel performs across compliance regimes.
- Energy Source at the Refinery: A HEFA refinery that runs on renewable energy has a lower carbon intensity score than one that runs on a fossil-heavy grid, even if the feedstock is identical. As such, the energy source used at the refinery is a major factor in aviation emissions reductions.
- Methodology and Accounting Framework: CORSIA uses the International Civil Aviation Organization's (ICAO) LCA methodology under Annex 16 Volume IV. The EU's RED II and ReFuelEU use their own default values. The US Sustainable Fuel Inflation Reduction Act (Section 40B, transitioning to 45Z) uses the GREET model developed by Argonne National Laboratory. The same production pathway can produce different reduction percentages under each framework, creating challenges for producers who want to certify across multiple markets at the same time.
- Co-Product Allocation: Unlike traditional jet fuel, SAF production often generates co-products such as renewable diesel, naphtha, and propane. The way you split lifecycle emissions across those co-products can also affect the SAF-specific carbon intensity figure.
Why it Matters: The Regulatory and Policy Landscape for SAF Emissions
The reduction percentage is more than an environmental metric. Under current SAF policies across the major compliance regimes, it determines compliance value and, in some cases, tax credit revenue.
.avif)
CORSIA
ICAO's Carbon Offsetting and Reduction Scheme for International Aviation (CORSIA) requires airlines to offset or reduce emissions growth above a 2019–2020 baseline. SAF that meets CORSIA's sustainability criteria and achieves at least a 10% lifecycle emissions reduction (net of iLUC) qualifies for compliance purposes. Higher reduction percentages generate more compliance value per tonne of fuel used.
CORSIA Phase 1 (2024–2026) is now mandatory for 126 participating states. Airlines face a three-way optimization: Procure SAF, purchase CORSIA-eligible carbon credits, or source lower carbon aviation fuel (LCAF). The optimal mix depends on the verified CI data for each option and their relative costs.
US Inflation Reduction Act (IRA)
The IRA's SAF tax credit—originally Section 40B, but transitioning to 45Z—provides $1.25–$1.75 per gallon for SAF achieving at least 50% lifecycle emissions reduction.
The credit value scales with the reduction percentage, which means a pathway that achieves 75% reduction earns more per gallon than one that achieves 55%. So, accurate lifecycle measurement isn't only a compliance exercise. It also determines tax credit value and revenue potential.
As of this writing, the Department of Energy uses the GREET model for IRA calculations. That said, the 45Z transition and associated policy details continue to evolve.
EU ReFuelEU Aviation and RED II
ReFuelEU mandates minimum SAF blending percentages for flights departing EU airports: 2% from 2025, scaling to 70% by 2050. A sub-mandate for synthetic SAF (PtL) starts at 1.2% in 2030.
RED II sets sustainability criteria and greenhouse gas emissions reduction thresholds that fuels must meet to count as renewable. Both frameworks create compliance demand for verified lifecycle data, since airlines and fuel suppliers need to demonstrate their SAF meets reduction thresholds.
Beyond SAF: The Emergence of Lower Carbon Aviation Fuel (LCAF)
Lower carbon aviation fuel (LCAF) is conventional jet fuel produced from crude oil with lower-than-average upstream carbon intensity. In other words, it doesn't replace the fossil feedstock. Instead, it reduces the emissions associated with extracting and refining it.
Under CORSIA, LCAF that meets the eligibility criteria can contribute to airline compliance obligations. For airlines, LCAF is attractive because it's cheaper than SAF and requires zero changes to existing aircraft or airport infrastructure. One methodology is working its way through the CORSIA approval process, but it represents a direct convergence of oil CI, aviation compliance, and carbon data.
The compliance equation for airlines is SAF (high reduction, higher cost) combined with LCAF (moderate reduction, lower cost) and carbon credits (flexible, variable cost). Evaluating that trade-off requires integrated data across fuel carbon intensity and carbon credit quality, which Sylvera can help with.
Where Sylvera Stands
Sylvera offers independent ratings, market data, and carbon intensity assessments across carbon credits and low-carbon commodities. For aviation, our capabilities span both sides of the compliance equation.
On the fuel side, our Carbon Intensity Assessment product delivers facility-level CI verification for fuel producers, including SAF pathways. Our standardized methodology enables like-for-like comparison across producers, feedstocks, and production routes. For SAF producers who target multiple compliance regimes simultaneously, Sylvera calculates CI under CORSIA, RED II/ReFuelEU, and IRA/GREET frameworks from a single data input. This eliminates the need for separate studies per regime.
Our Commodity Insights product provides market-level benchmarking across fuel producers, giving airlines and fuel buyers the ability to compare SAF suppliers by verified lifecycle CI rather than marketing claims. For the carbon credit side of the compliance portfolio, Sylvera's Market Intelligence platform covers carbon credit pricing and quality data, including CORSIA-eligible credits.
To reach net zero emissions in the aviation sector, you need good numbers. Whether you're an airline optimizing a compliance strategy, a SAF producer proving your carbon advantage, or a climate finance investor assessing SAF deployment risk, quality lifecycle data leads to quality decisions.
Request a demo to see how Sylvera's carbon intensity data supports your SAF procurement and aviation compliance strategy.