
“Over the years we’ve invested significantly in our field data team - focusing on producing trusted ratings. While this ensures the accuracy of our Ratings, it doesn’t allow the scale across the thousands of projects that buyers are considering.”

For more information on carbon credit procurement trends, read our "Key Takeaways for 2025" article. We share five, data-backed tips to improve your procurement strategy.

One more thing: Connect to Supply customers also get access to the rest of Sylvera's tools. That means you can easily see project ratings and evaluate an individual project's strengths, procure quality carbon credits, and even monitor project activity (particularly if you’ve invested at the pre-issuance stage.)
Book a free demo of Sylvera to see our platform's procurement and reporting features in action.
What Is the Carbon Intensity of Fuels?
Carbon intensity measures the total greenhouse gas emissions produced per unit of fuel energy. The most common unit is grams of CO2 equivalent per megajoule (gCO₂e/MJ), though you'll also see kilograms per litre (kgCO₂e per litre) or lifecycle emissions per tonne of fuel.
To fully understand the carbon intensity of fuel oils, we must distinguish between combustion emissions and lifecycle emissions. Most people only think about the carbon dioxide emitted when an engine burns fuel. This process, which sometimes results in incomplete combustion, releases greenhouse gases into the atmosphere. However, combustion is only half the story.
Lifecycle emissions, often called "well-to-wheel" or "well-to-wake," provide a more complete picture. This calculation takes every stage of the fuel's journey into account, including:
- Extraction: The energy used to pull crude oil or natural gas from the ground.
- Refining: The complex industrial process that converts raw materials into usable products, such as motor gasoline and distillate fuel oil, amongst others.
- Transport: The emissions from moving the fuel via pipeline, ship, or truck.
- Combustion: The release of carbon dioxide and other greenhouse gases during use.
.avif)
From now on, most carbon intensity regulations will focus on lifecycle emissions, not just combustion emissions. This means two fuels with identical combustion emissions can have very different regulatory treatment based on their production pathway. For example, a fuel produced in a power plant using renewable energy will have a much lower CI than the same fuel produced using coal-fired electricity.
Crucially, the carbon intensity story starts even before the refinery, at the wellhead. The crude oil feedstock itself carries an upstream emissions profile that flows through to the finished fuel. Two refineries running at identical efficiency can produce fuels with meaningfully different lifecycle carbon intensities simply because of the crude streams they process.
Why Carbon Intensity Matters in Energy Markets
Carbon intensity of fossil fuels is now an environmental and commercial metric.
Climate policy and net-zero commitments drive this change. Governments around the world are setting aggressive targets to reduce total greenhouse gas emissions. This forces companies to evaluate the carbon intensity of fossil fuels they consume. Carbon pricing mechanisms further accelerate this by attaching a direct financial cost to high-carbon energy sources.
Then, there's the emergence of new supply chain disclosure requirements. Frameworks like the Carbon Border Adjustment Mechanism (CBAM) in the EU, SEC climate rules in the US, and the Corporate Sustainability Reporting Directive (CSRD) require businesses to report accurate emissions. And many procurement standards include maximum CI thresholds for suppliers.
Reporting pressure is particularly intense in the transportation industry. Aviation faces CORSIA compliance obligations and growing demand for sustainable aviation fuel (SAF). Shipping must respond to FuelEU Maritime and IMO 2050 decarbonization targets. And road transport sits under Low Carbon Fuel Standards (LCFS) in California, Oregon, and Canada, with similar frameworks emerging in the EU.
As such, carbon intensity is now a trade metric. Carbon intensity of fuels will dictate their market value, as well as their ability to cross borders without incurring heavy tariffs. And this is no longer a distant prospect. The infrastructure to reward cleaner production is beginning to take shape, and the data to support it is now emerging.
Carbon Intensity of Diesel Fuel
Diesel powers freight, construction, and a significant share of global shipping.
Its lifecycle carbon intensity typically falls in the range of 90 to 100 gCO₂e/MJ, though this number can vary by 15 to 20% depending on supply chain specifics.
Some of the factors that shift the carbon intensity of diesel fuel include:
- Crude Oil Type: Heavy crude requires more energy to process than light crude.
- Extraction Method: Techniques like steam-assisted gravity drainage for oil sands are more carbon-intensive than traditional drilling methods.
- Methane leakage: Methane that escapes during extraction can spike total emissions.
- Energy Usage: The refinery's energy efficiency score, and whether it uses electricity generation from renewable energy or fossil sources, affects the final CI.
- Transport Distance: Moving fuel across the ocean via tanker adds more to the company's carbon footprint than local pipeline distribution.
This variation matters. A diesel supply sourced from a high-efficiency refinery using lower-carbon crude will have a different emissions profile than one produced from oil sands with a conventional refinery configuration. As emission factors become part of supplier qualification criteria, these differences will determine commercial decisions.
Carbon Intensity of Gasoline
As a major contributor to emissions in the transport sector, the carbon intensity of gasoline is under intense scrutiny. The typical range for this fuel is 93-100 gCO2e/MJ.
While gasoline's CI profile looks similar to diesel, subtle differences exist due to:
- Refining Processes: The refining process for motor gasoline involves different chemical transformations than diesel, which changes the necessary energy profile.
- Energy Density: Gasoline and diesel have a different heat content. The energy produced per gallon or short ton is different too, resulting in different CIs.
- Vehicle Efficiency: The average efficiency of gasoline engines versus diesel engines, affects the total amount of carbon dioxide emissions. This difference is key when considering the energy required to move the same mass over a given distance.
Since gasoline is used in most passenger vehicles, small reductions in its CI can lead to massive drops in the total amount of greenhouse gases entering the atmosphere.
Carbon Intensity of Jet Fuel
Aviation is a difficult sector to decarbonize because battery weights make electrification impractical, and hydrogen faces significant infrastructure challenges. As such, the aviation industry continues to use jet fuel, which has a carbon intensity between 88 and 95 gCO₂e/MJ. (It should be said, the sector is shifting to sustainable aviation fuels (SAF) to lower this number.)
The regulatory context here is particularly strict:
- CORSIA: This international scheme creates compliance obligations that airlines must meet to help offset or reduce the emissions they generate via air travel. Under CORSIA, eligibility for lower carbon aviation fuel (LCAF) status is determined partly by the lifecycle carbon intensity of the crude feedstock itself. So the upstream CI of the crude stream used to produce jet fuel has direct compliance implications.
- Airlines' Choices: Carriers must choose between buying carbon credits, procuring SAF, or using LCAF to adhere to new regulations.
- SAF Impact: Depending on the feedstock and production pathway, SAF can achieve a 50-80% lifecycle emissions reduction compared to conventional fuel.
It is important to understand that SAF aims to reduce lifecycle carbon intensity rather than eliminate carbon dioxide at the point of combustion. When SAF burns, it still releases carbon dioxide. However, because the plants or other biomass feedstock used to make the fuel absorb CO from the atmosphere as they grow, the net impact is much lower.
Why Fuel Carbon Intensity Varies So Much
Two facilities producing the same type of fuel can end up with very different carbon intensity scores. Understanding why this happens will help you make smarter sourcing decisions.
Crude Oil Source
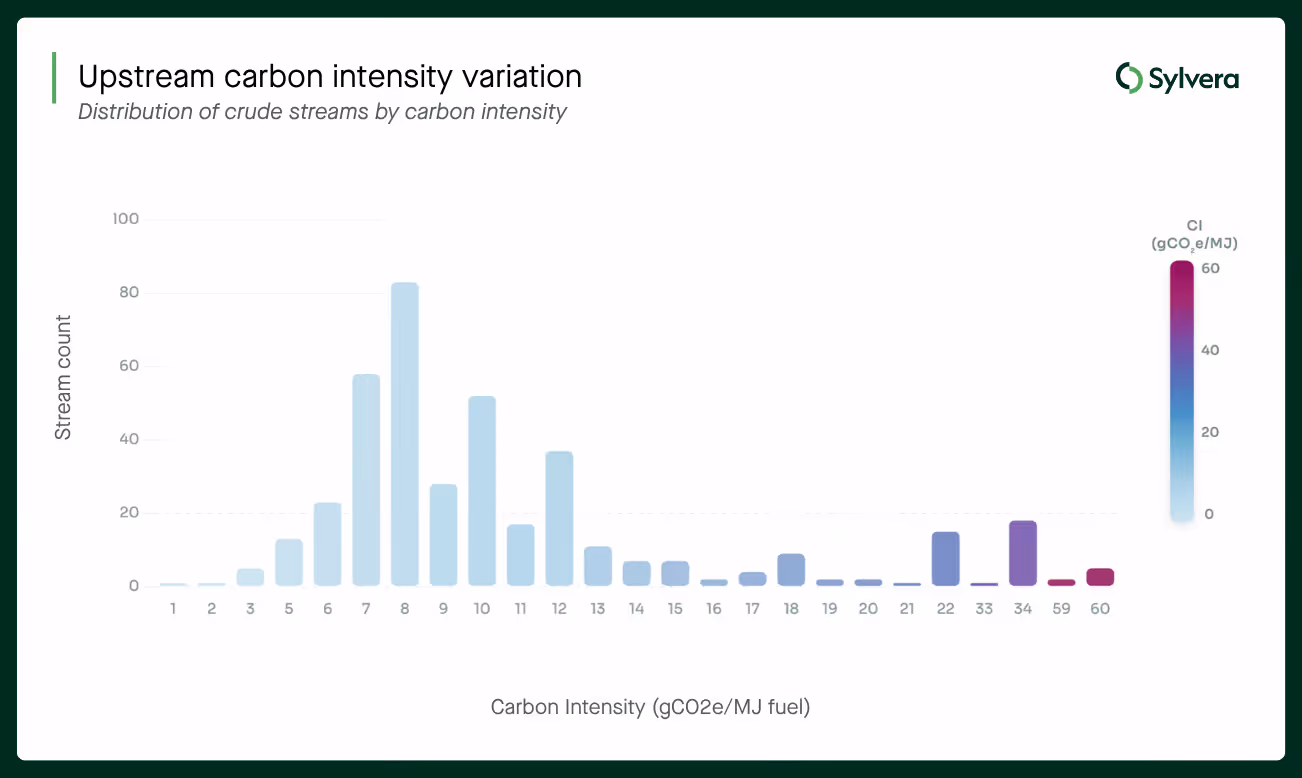
The crude oil feedstock is one of the most significant and least-discussed drivers of fuel carbon intensity. Sylvera's analysis of 400+ globally traded crude streams reveals a 60x variation in upstream carbon intensity across streams. This range dwarfs what most buyers and refiners currently factor into procurement decisions.
There is a major difference between heavy and light crude oil, as well as offshore and onshore production. Heavy crude requires extra heat and steam to extract, which increases carbon dioxide emissions before it reaches a vehicle or aircraft. As such, heavy crude has a higher CI.
The average upstream barrel emits approximately 16–20 kg CO₂e, yet best-in-class assets already operate below 5–10 kg CO₂e per barrel, a gap that carries real commercial value as regulations tighten.
Refinery Energy Intensity
Refineries must expend a significant amount of energy to separate crude oil into different types of fuel. High hydrogen use and constant heat demand can also increase emissions if the refinery relies on fossil fuels to generate electricity. Newer facilities that integrate carbon capture and storage (CCS) or renewable energy sources like wind or solar achieve a much lower CI.
Transport and Logistics
Shipping crude and refined products around the world increases emissions. The amount of emissions, though, depends on the mode of transportation, as pipelines, tankers, and rail systems each carry different carbon footprints. For example, if two fuels produce the same amount of emissions, but one is transported by rail across several continents while the other is delivered locally via pipeline, the first will end up with a higher lifecycle score.
Production Technology
For alternative fuels like renewable diesel, SAF, biodiesel, and hydrogen-derived fuels, the production pathway is the single biggest driver of carbon intensity. The feedstock, electricity source, production pathway, and carbon capture integration—whether CO2 from production is captured or not—all determine where the final product lands on the carbon intensity spectrum.
Even within conventional crude production, technology matters significantly. Norway's offshore extraction, for example, is powered largely by onshore renewable grid electricity rather than on-site fuel combustion, resulting in a materially lower upstream CI than would otherwise be expected for North Sea production.
Renewable and Low-Carbon Fuels
To reach net-zero emissions, the world must use fuels with lower carbon intensities than traditional fossil-based options. These alternative fuels include:
- Renewable diesel and biodiesel
- Sustainable aviation fuel (SAF)
- Synthetic fuels (e-fuels)
- Hydrogen-derived fuels (like ammonia or methanol)
.avif)
The CI of these fuels isn't a fixed number. It depends on feedstock, electricity sources, and land use impacts. It's impossible to compare the CI of different oils without detailed data.
But the same is increasingly true for conventional fuels. The crude stream matters. The extraction method matters. The production geography matters. Lower-carbon barrels deserve better economics — and the data to make that case is now available.
How Regulations Are Starting to Price Fuel Carbon Intensity
Policy frameworks now use carbon intensity to calculate pricing.
California's Low Carbon Fuel Standard (LCFS) is one example. It assigns a carbon intensity score to every fuel pathway. Suppliers that score below the baseline generate credits they can sell. Suppliers above the baseline must purchase credits. This creates a direct price signal tied to lifecycle emissions by rewarding lower-carbon fuels with measurable revenue.
Under LCFS, crude selection directly affects incremental deficit exposure for refiners — a commercial reality that makes upstream CI data actionable today.
Other emerging policies include FuelEU Maritime for shipping and various aviation decarbonization policies for the airline industry. Canada's Clean Fuel Regulation (CFR) similarly assigns carbon-intensity limits to liquid fossil fuels, with crude streams carrying lower lifecycle CI having the potential to generate compliance credits.
These systems reward fuels with lower lifecycle emissions, effectively turning carbon intensity into a currency.
The Strategic Shift: Carbon Intensity as a Commodity Attribute
Carbon intensity is now a part of the way fuel is bought and sold. Buyers across sectors compare each supplier based on verified emissions data, not just price and logistics.
It makes sense, as different buyers have different carbon intensity needs. Consider:
- A fuel distributor who operates under California's LCFS needs a verified carbon intensity pathway to generate or surrender the right credits at the right times.
- An EU airline sourcing SAF needs documentation to confirm that the fuel meets sustainability criteria under the Renewable Energy Directive (RED II).
- A maritime operator trading in EU ports needs certified lifecycle emissions data to demonstrate FuelEU compliance and continue doing business as usual.
- A corporate buyer with a net-zero commitment needs to reduce Scope 1 and Scope 3 emissions, making carbon intensity critical to every annual reporting task.
These buyers have different regulatory environments and different internal targets, but they share a common need: reliable, independently verified carbon intensity data.
Also of note, fuel markets are converging with carbon credit markets. Airlines must balance SAF procurement against carbon credit purchasing based on relative cost and emissions impact. And industrial buyers evaluate fuel switching against offsetting strategies. Understanding the trade-offs requires integrated carbon intensity and carbon credit data.
Where Sylvera Stands
Sylvera provides trusted data and tools across carbon markets and commodities to help organizations measure, benchmark, and act on carbon intensity information with confidence.
.avif)
Mechanism Eligibility & Value Assessment
Our Mechanism Eligibility & Value Assessment helps producers know exactly which schemes their facility qualifies for, and what that's worth commercially. Get a clear, auditable answer across CBAM, LCFS, EACs, and more, with a market-priced value estimate per mechanism.
Carbon Intensity Assessment
Sylvera delivers independent carbon intensity assessments for crude oil streams, hydrogen, ammonia, cement, and other commodities. This allows companies to compare emissions performance across suppliers and production pathways, and to prove their carbon advantage in markets where verified data is required for compliance and/or premium pricing.
Commodity Insights
Sylvera's Commodity Insights tool helps companies benchmark carbon intensity across global supply chains. Because of this, our platform provides data to understand how carbon attributes influence a company’s competitiveness and regulatory standing.
As part of Commodity Insights, Sylvera has published carbon intensity data across 400+ globally traded crude streams — the first framework of its kind to move beyond aggregate country-level labels to a continuous, crude-stream-specific scale. CI is expressed in gCO₂e/MJ, covering the cradle-to-gate system boundary (well-to-facility gate), aligned to IPCC AR6 GWP100. Each CI value is paired with a confidence score reflecting data completeness and granularity.
Beyond CI scoring, the framework includes estimated mechanism eligibility — enabling producers, refiners, traders, and buyers to understand which crude streams are likely to qualify under CORSIA LCAF, California LCFS, and Canada's Clean Fuel Regulation, and what that means commercially. Producers who invest in reducing emissions per barrel can now evidence that advantage with independent, standardised data.
The Future of Fuel Carbon Intensity
Carbon intensity is becoming a primary regulatory and trade metric. This is proven by the fact that supply chains now require verified emissions data to function.
Reducing emissions per barrel is not just an environmental metric, but a commercial one. Lower-carbon barrels should command a price premium. The infrastructure to reward cleaner production is still being built, but the data to support it now exists.
As alternative fuels like renewable diesel and SAF continue to emerge, the ability to differentiate them by their true climate impact will be vital. We also expect to see a deeper integration between physical fuel markets and carbon markets as both become more mature.
Ultimately, the companies that can measure and verify fuel carbon intensity now will gain a significant competitive advantage as the energy transition accelerates.
Understand the Carbon Intensity of Different Fuels
The carbon intensity of fuels is a key metric shaping the global energy transition.
As policies and markets differentiate these fuels based on lifecycle emissions, this metric will influence everything from daily fuel procurement to international trade agreements.
Sylvera is ready to help. Our carbon intensity assessment and commodity insights help organizations measure, benchmark, and act on carbon intensity across their entire supply chain.