“Over the years we’ve invested significantly in our field data team - focusing on producing trusted ratings. While this ensures the accuracy of our Ratings, it doesn’t allow the scale across the thousands of projects that buyers are considering.”

For more information on carbon credit procurement trends, read our "Key Takeaways for 2025" article. We share five, data-backed tips to improve your procurement strategy.
One more thing: Connect to Supply customers also get access to the rest of Sylvera's tools. That means you can easily see project ratings and evaluate an individual project's strengths, procure quality carbon credits, and even monitor project activity (particularly if you’ve invested at the pre-issuance stage.)
Book a free demo of Sylvera to see our platform's procurement and reporting features in action.
Headline numbers
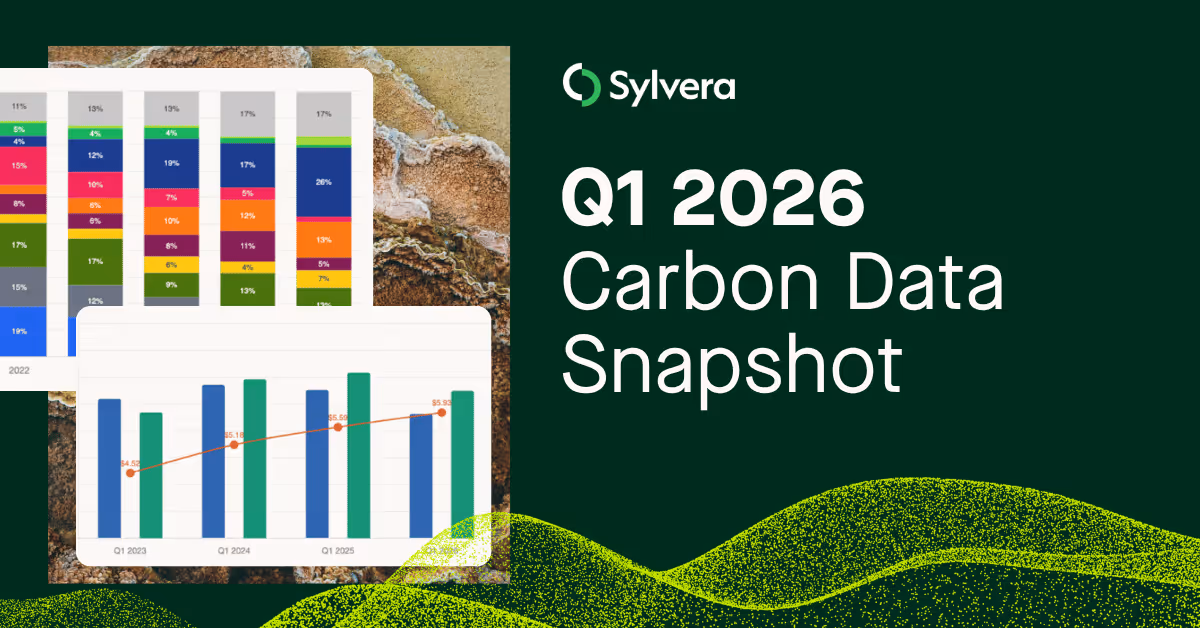
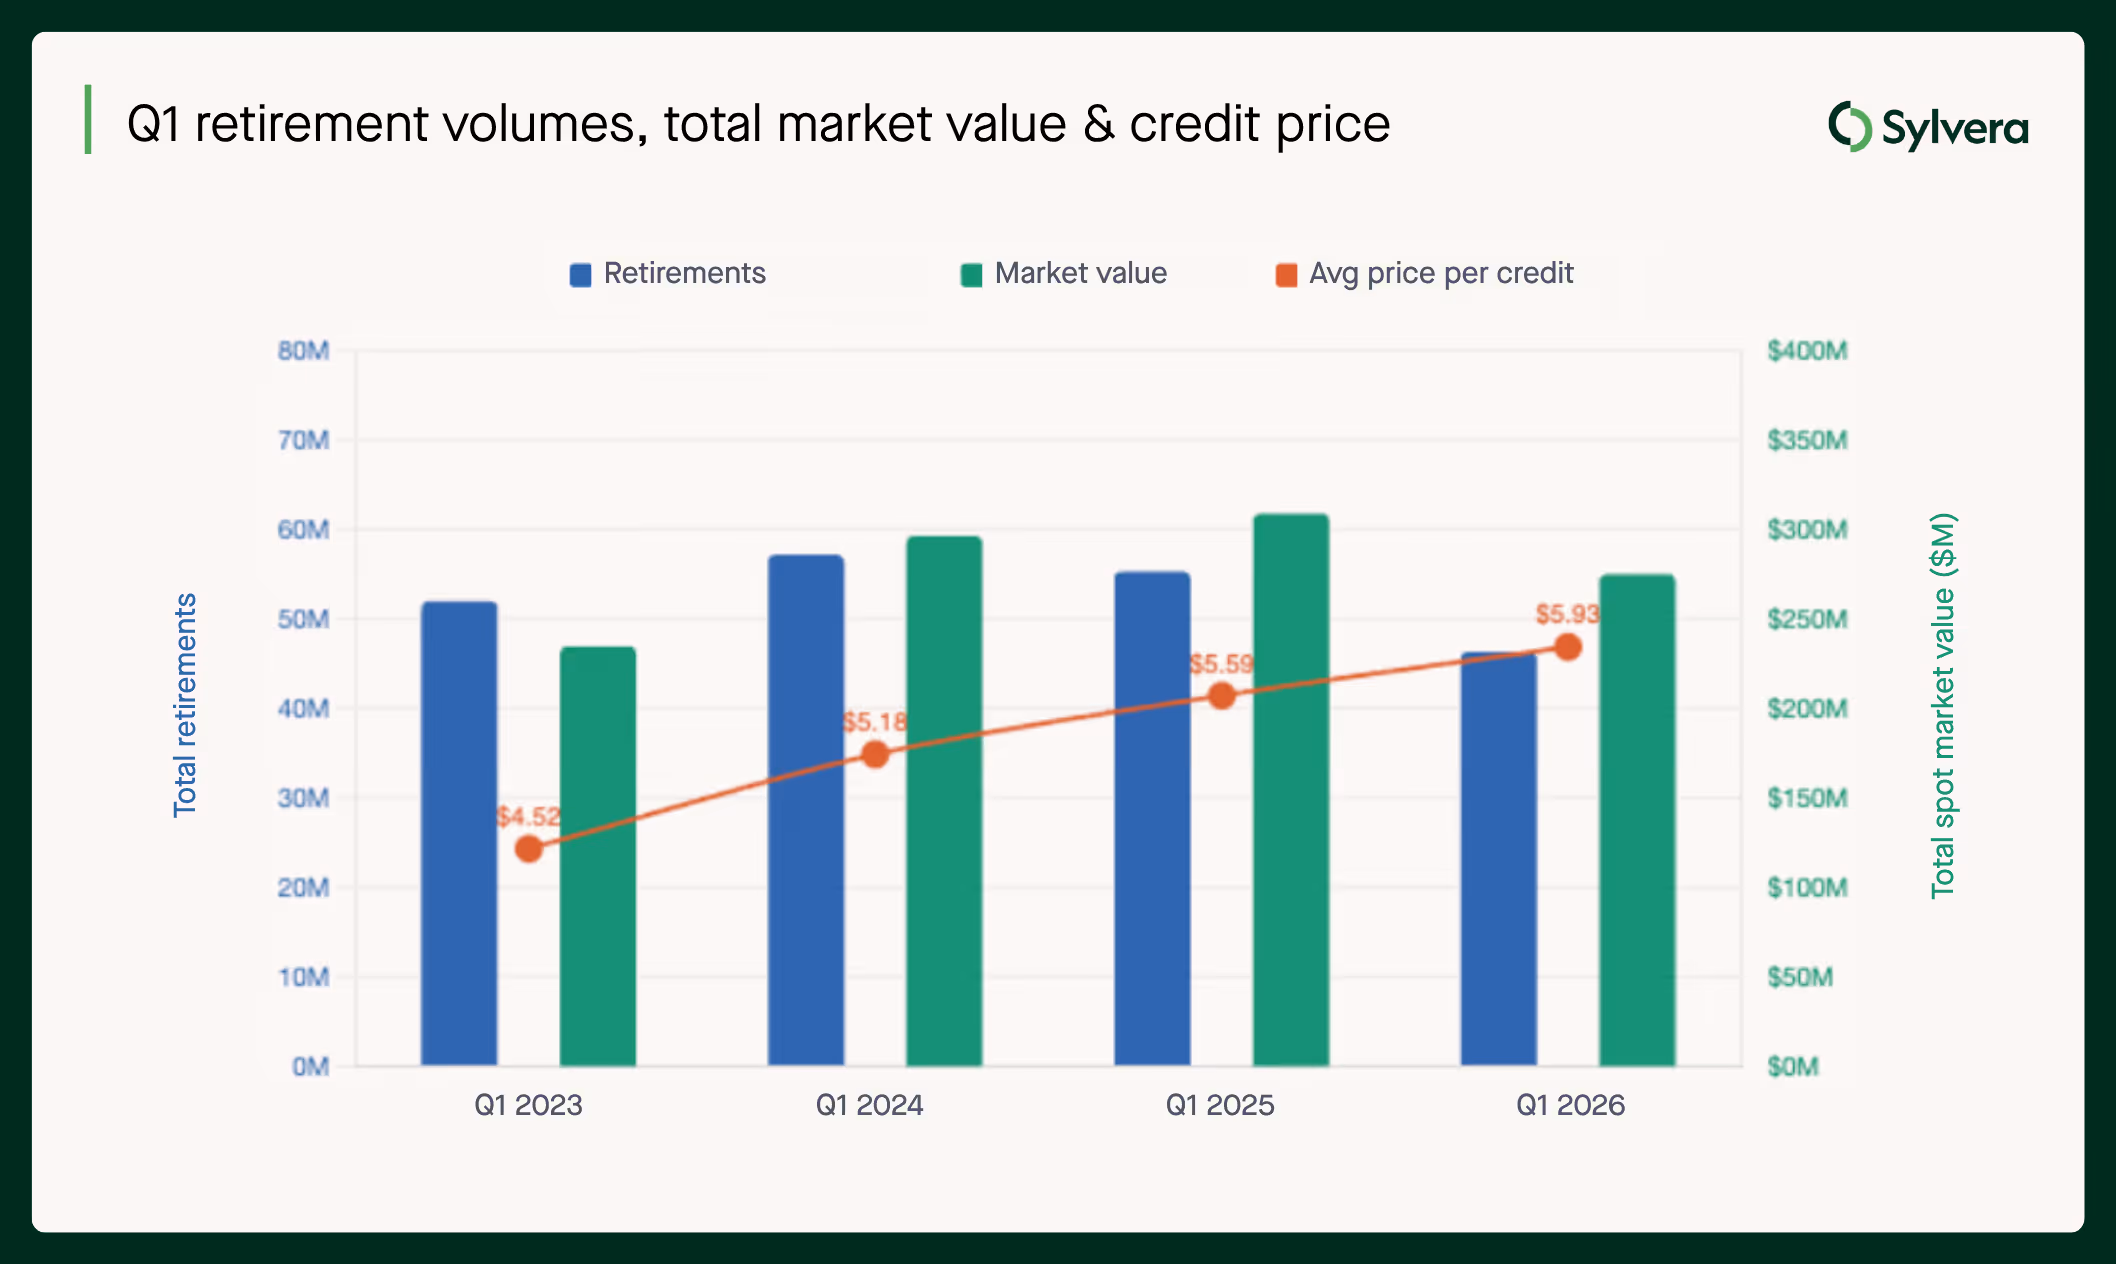
Carbon credit retirements reached 51 million in Q1 2026, down 8% from 55.3 million in Q1 2025. Total retirement market value dropped to $290 million, down from $309million a year earlier.
A key driver behind the decline in retirements is reduced activity from Shell - historically the largest retiree in the market - so far this year, with Q1 2026 retirements at 494k credits, down sharply from 6.7M in Q1 2025 and 5.6M in Q1 2024.
As highlighted in Sylvera's recent State of Carbon Credits report, the carbon market is increasingly defined by a volume vs. value dynamic, and Q1 2026 bears that out. The average price paid per credit retired rose slightly to $5.69 in Q1 2026, up from $5.60 in Q1 2025.
For a full dive into the latest intelligence around pricing, quality, and demand trends, check our comprehensive State of Carbon Credits report.

Quality and price
The quality premium
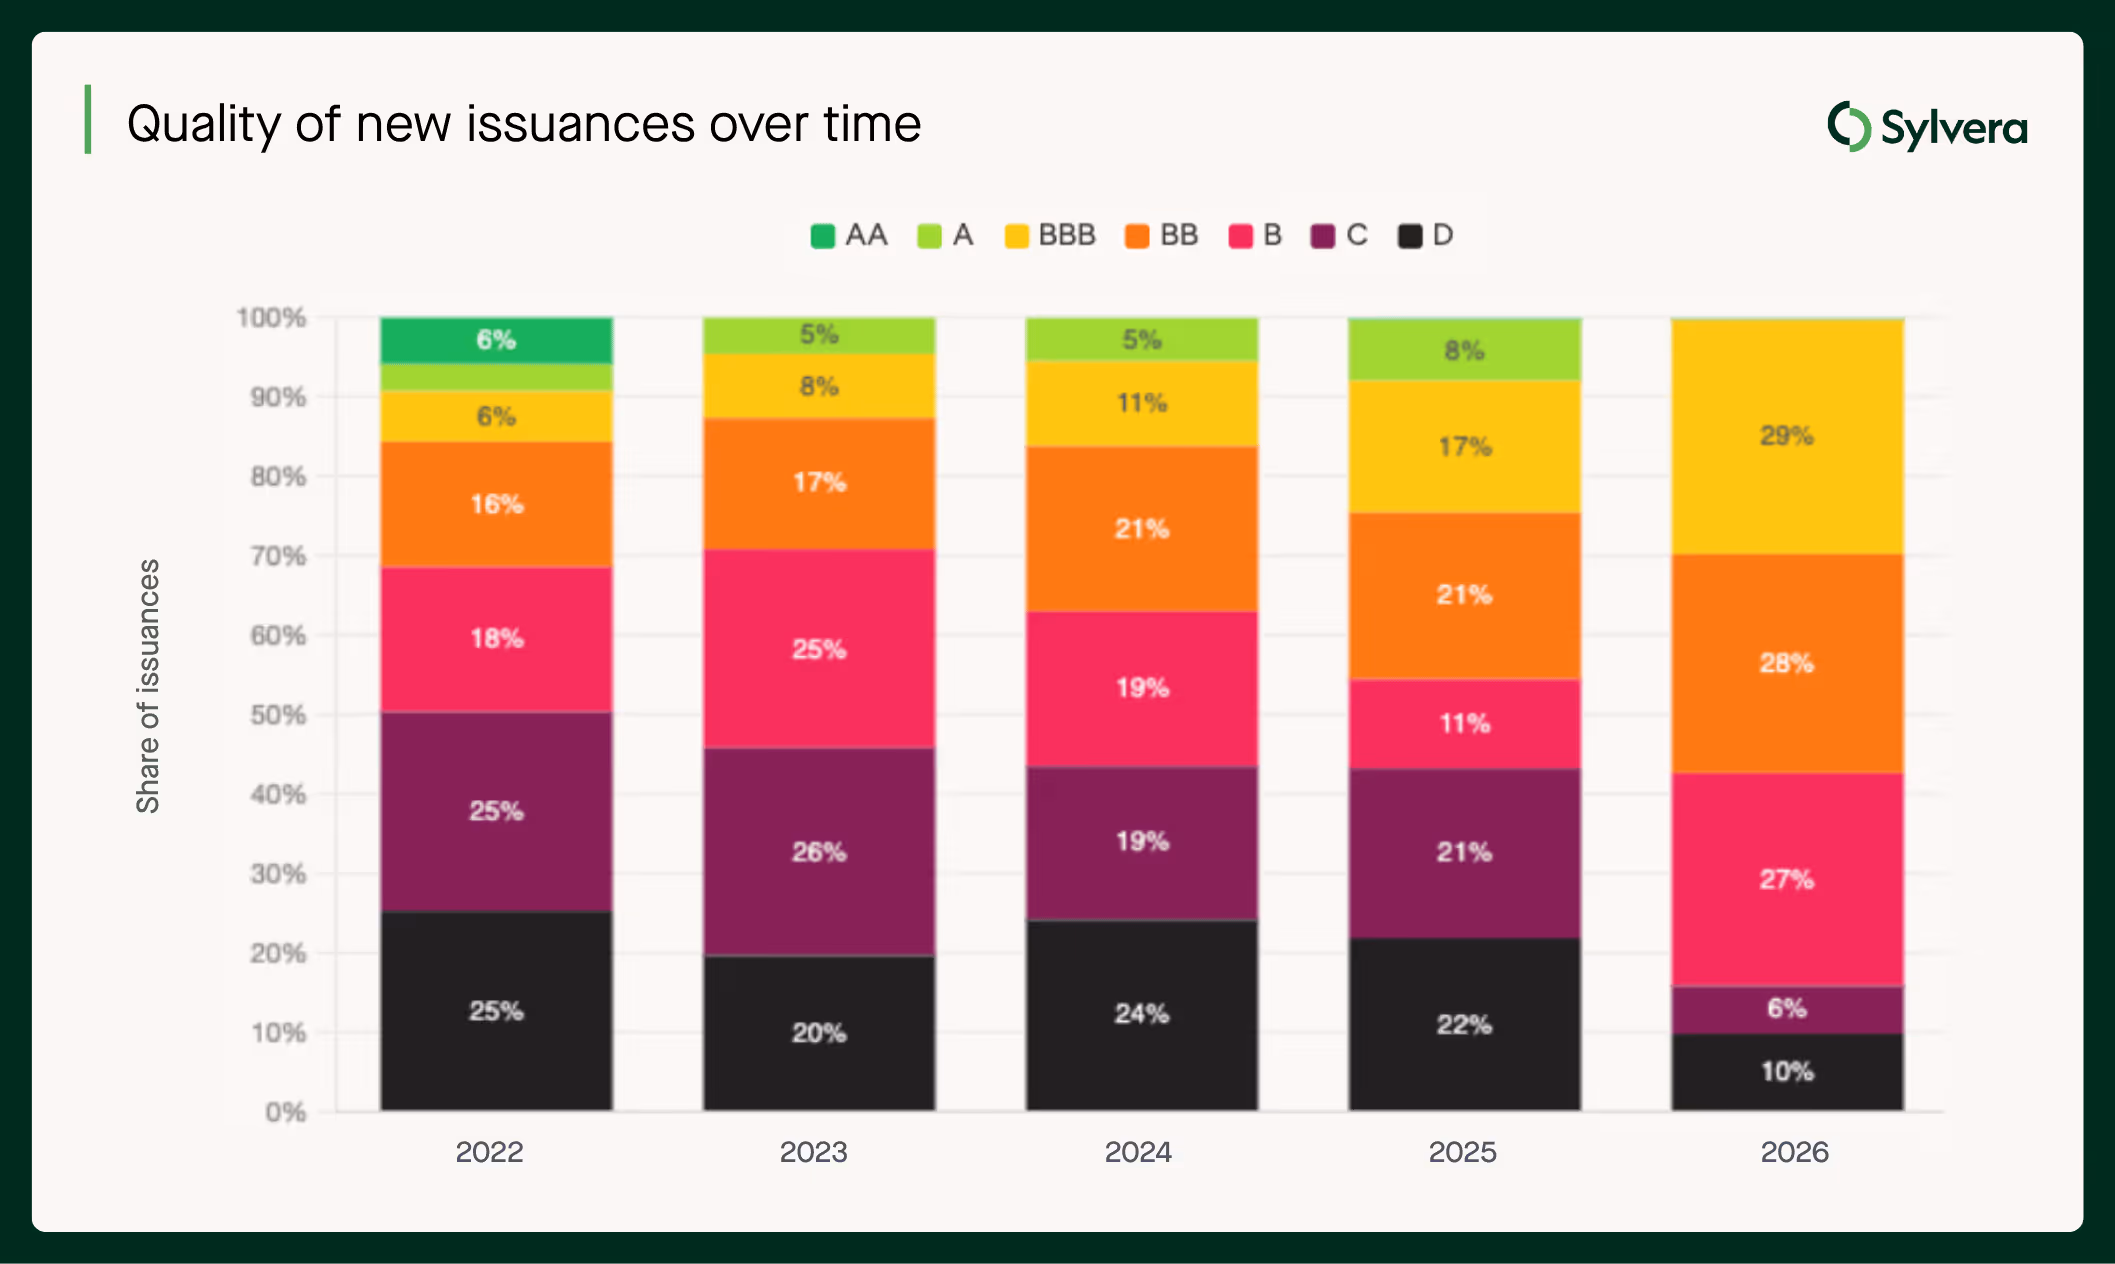
Investment-grade credits (BBB+) now command an average of $20.10 per credit in Q1 2026, up from $18.10 in Q1 2025. B-rated credits sit at $7.80, down from $8.50 a year ago. BBB+ rated credits now account for 30% of new rated issuances and 62% of total rated market value, up from 13% and 31% respectively in 2023. The market’s quality composition has changed significantly.
High-rated REDD+ (BBB+) prices have risen for three consecutive quarters to $9.60 in Q1 2026, while low-rated REDD+ is flat at $3.70.

Compliance eligibility
For the first time, CORSIA-eligible* credits represent close to 50% of new issuances. Compliance-eligible supply continues to grow, driven by the collapse of out-of-scope legacy renewables and the growth of eligible categories such as IFM and cookstoves.
CCP accreditation has grown from under 3% of issuances in 2023 to 18% in Q1 2026. The CCP price premium has more than doubled to $3.83 since 2023.
A real example of this compliance premium sits in an African cookstoves project. DelAgua's BBB-rated project in Gambia commands median prices around $20 per credit, nearly five times the Cookstoves market average of $4.54. The price of these credits was ~$5 before its CORSIA eligibility* was noted.

CORSIA supply growing, but gap remains
In terms of CORSIA progress, on the supply side, fully eligible emissions units (EEUs) across Verra, Gold Standard, and ART TREES registries now total 32.68 million, more than double the 15.84 million available in Q1 2025.
On the demand side, early compliance activity is emerging. In Q1 2026, Japan Airlines retired 235,000 EEUs toward Phase 1 compliance, and in March 2026 Guyana's Minister confirmed that 19 airlines have purchased credits from the country, though no names or volumes were disclosed.
But the central question remains whether supply of fully authorised, correspondingly adjusted credits will scale fast enough to meet projected Phase 1 demand of 181 million credits ahead of the compliance deadline of 31 January 2028. The authorization bottleneck, requiring host country sign-off under Article 6 of the Paris Agreement, is the critical constraint. KOKO Networks was a notable victim of this challenge in Q1 of this year.
Project types
Cookstoves
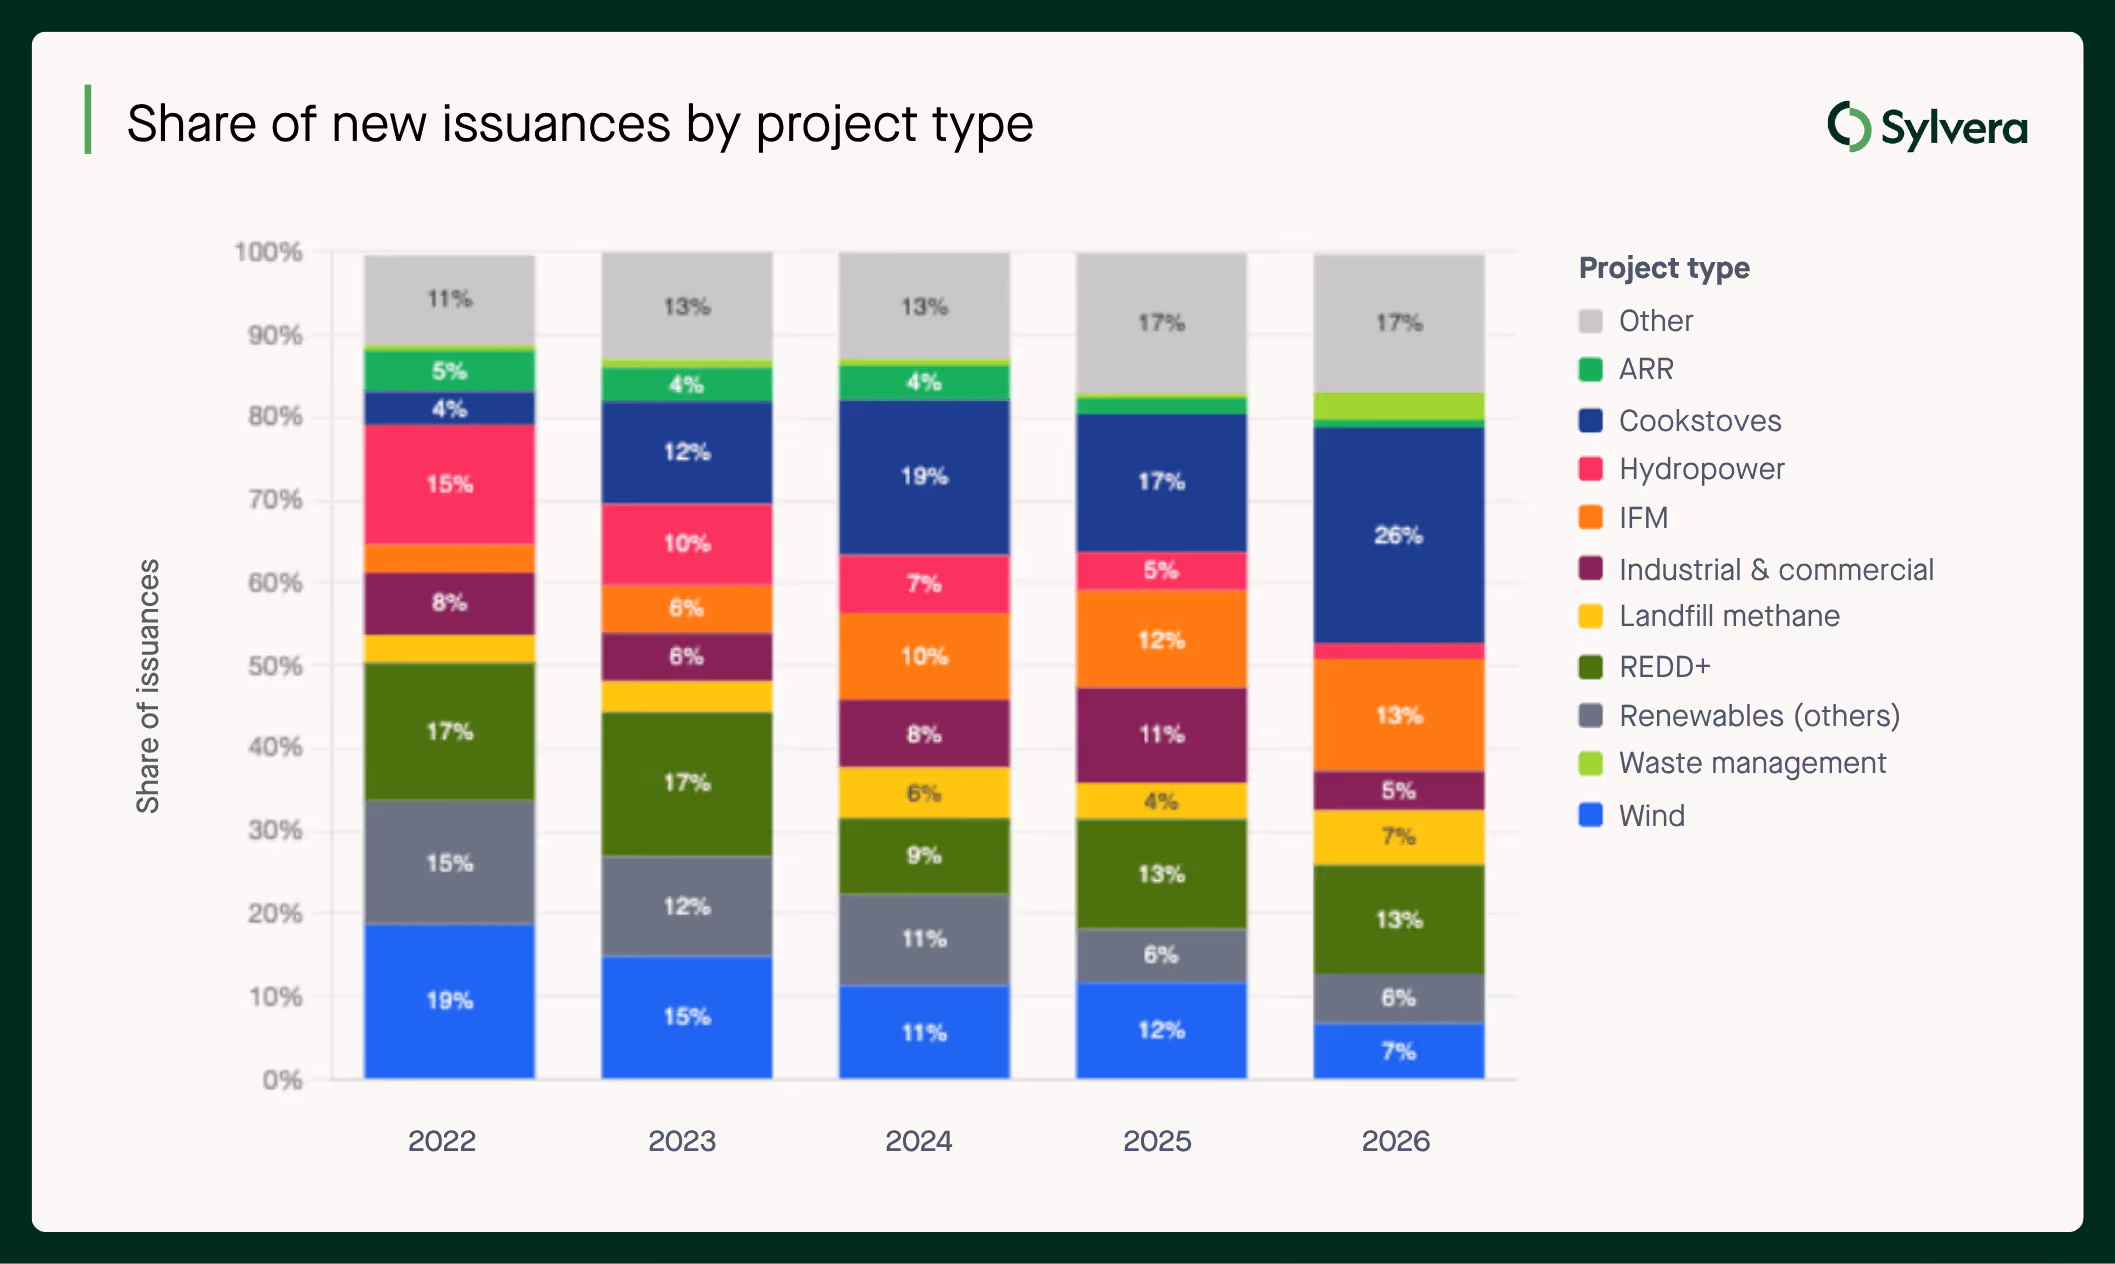
The share of cookstoves issuances has grown from 17% of the market in 2025 to 26% in Q1 2026. Africa accounts for roughly 80% of supply, and ~80% of projects fall within CORSIA Phase 1 scope*.
The cookstoves methodology picture is improving. Legacy AMS-II.G has effectively exited new issuances. VMR0006 now represents 56% of Q1 2026 issuances, Gold Standard at 34%, and VM0050 growing to 7%. More rigorous, measurement-based methodologies signal a gradual quality upgrade.
REDD+ recovery
REDD+ retirement share has risen to 25% in Q1 2026, up from 22% in 2025, a signal that confidence in this project type is recovering after years of credibility scrutiny.
Three forces are driving the rebound. Verra's revised VM0048 methodology has raised the bar for new supply, removing lower-quality credits and improving confidence in those that remain. The finalisation of Article 6 rules at COP29 gave corporate buyers greater certainty about REDD+'s role in compliant markets.
Waste management
The waste management category has reached its highest-ever retirement share at 10% in Q1 2026. Landfill methane (LFM) projects are the primary driver, with strong CORSIA eligibility and an improving quality profile make this an increasingly attractive option for buyers moving beyond forestry and renewables.
New supply sources growing
A group of project types has emerged over recent years to form a significant portion of the market:
- Clean Water: 38× growth since 2021 to 8.2 million credits annually at the end of 2025, now the largest subcategory in this emerging group, with consistent annual growth every year.
- Marine and Mangrove Carbon: Steady growth to 5.3 million credits. High permanence credentials and strong co-benefits are attracting quality-conscious buyers.
- NDAAP: N₂O destruction at nitric acid plants has grown 17× since 2021 to 6.7 million credits. Verifiable, measurable, broadly CORSIA-aligned.
- Regenerative Agriculture: Essentially zero through 2024, then 3.0 million in 2025, annualising at over 5 million in Q1 2026. The fastest rate of change of any subcategory in the dataset.
Supply-side: Regional stories
North America leads in terms of quality supply. 57% of rated issuances in North America are rated BBB or above. IFM dominates, with US issuances near-doubling since 2021 and Mexico growing from near-zero to 7.3 million credits annually, with a high quality profile.
The median price of a North American credit is $14.80, the highest of any region and up from $14.10 in 2025. This is supported by quality-conscious domestic buyers and broad CORSIA eligibility. Rigorous supply attracts quality buyers, which sustains premium pricing, which incentivises quality supply.
Africa is undergoing a quality transition in supply, with high-rated issuances growing and low-rated issuances shrinking. High-rated issuances have grown from 9.3M (2021) to 11.4M (2025), while low-rated has fallen from 15.5M to 7.2M. The quality share flipped from 37% high-rated in 2021 to 61% high-rated in 2025.
The driver is Cookstoves, with the shift toward Gold Standard and VMR0006 projects (which tend to be higher-rated) and away from older, lower-quality methodologies. Meanwhile African REDD+ issuances have fallen (19M to 7.7M), removing a large block of historically low-rated supply.
In South America, retirements are outpacing new supply. The quality mix has improved, not because high-rated supply is growing, but because low-rated supply has shrunk faster. The average price of a South American credit has dropped from $11.90 in Q1 2025 to $11.50 in Q1 2026.
South American LFM has shown growth in recent years, from near-zero to 5.2M in annual issuances and 5.9M in retirements, suggesting LFM is absorbing some of the REDD+ drop.
In Asia, issuances have fallen 65% since 2021 as renewable energy supply drops off. An average Asian carbon credit price of $5.30 in Q1 2026 is the lowest globally.
Currently there's a base level of compliance demand (China ETS, J-Credit) that won't disappear, but with Japan/Korea buyers declining in quality and volume, there's no upward pressure either.
Indonesia is the regional highlight, with average credit price up 26% year-on-year, driven by high-quality peatland projects (Sumatra Merang Peatland at $24.47, Katingan recovering to $10.68) and bilateral Article 6 engagement is adding a compliance premium to select projects.
Buyer-side: Regional preferences
The UK has seen a year-on-year quality transition from 37% high-rated retirements in 2022 to 85% in Q1 2026. Corporate disclosure pressure and VCMI guidance have seemingly changed how UK buyers purchase.
USA and Canada buyers have improved quality share YoY — 21% in 2022 to 68% in Q1 2026. A domestic preference for ACR/CAR-approved IFM and LFM combines quality and compliance-driven purchases.
EU and EEA buyers represent the largest volume of high-rated retirements and sit at a 51% share in 2026. REDD+ dominates the region’s retirements at 7.7M, but a significant portion of that is actually low-rated.
Japan and Korea buyers’ quality share has declined to 3% high-rated retirements in Q1 2026. So far this year, retirements have been almost entirely hydropower, driven by local offset mechanisms that, to date, have not incentivised quality.
Latin America sees a 10% high-rated share. Buyers are purchasing low-rated REDD+ from their own region without the regulatory or reputational pressure that has driven quality improvements elsewhere.
Market outlook
The Q1 2026 data sees retirement volume is down, but value is holding. The credits commanding that value are increasingly defined by quality, compliance-readiness, and methodological rigour. The bifurcation between investment-grade and legacy supply is the increasing reality of the voluntary carbon market.
As 2026 progresses, the central tension is supply. High-quality credits - the ones buyers prefer, the ones CORSIA needs, and the ones that command a price premium - are becoming scarcer. The authorisation bottleneck under Article 6 means that supply within scope of CORSIA on paper does not yet equal compliant supply in practice.
Want to explore these market dynamics yourself?
Our Market Intelligence suite provides transparency across the market with real-time pricing, supply and demand data.
💲 Pricing Data – Project-level spot estimates, with 20,000+ estimates powered by ~300,000 transactions.
📈 Market Data – Weekly issuances and retirements, filterable average prices, and known supply integration.
🏢 Buyer Directory – See who’s retiring what by sector, type, vintage, and geography to validate demand.
Find out more about Market Intelligence here, or request your free demo now.
* subject to host country authorisation.