“Over the years we’ve invested significantly in our field data team - focusing on producing trusted ratings. While this ensures the accuracy of our Ratings, it doesn’t allow the scale across the thousands of projects that buyers are considering.”

For more information on carbon credit procurement trends, read our "Key Takeaways for 2025" article. We share five, data-backed tips to improve your procurement strategy.
One more thing: Connect to Supply customers also get access to the rest of Sylvera's tools. That means you can easily see project ratings and evaluate an individual project's strengths, procure quality carbon credits, and even monitor project activity (particularly if you’ve invested at the pre-issuance stage.)
Book a free demo of Sylvera to see our platform's procurement and reporting features in action.
When analyzing carbon projects, Sylvera utilizes machine learning (ML) and multiple types of satellite data to identify specific features of forests and land cover. Examples of these features include:
- forest vs. non-forest
- canopy height
- canopy cover
- above ground biomass
This article outlines how we leverage ML for different project analyses and how it sets us apart from the competition.
Download our machine learning fact sheet here.
What is machine learning and why do we use it?
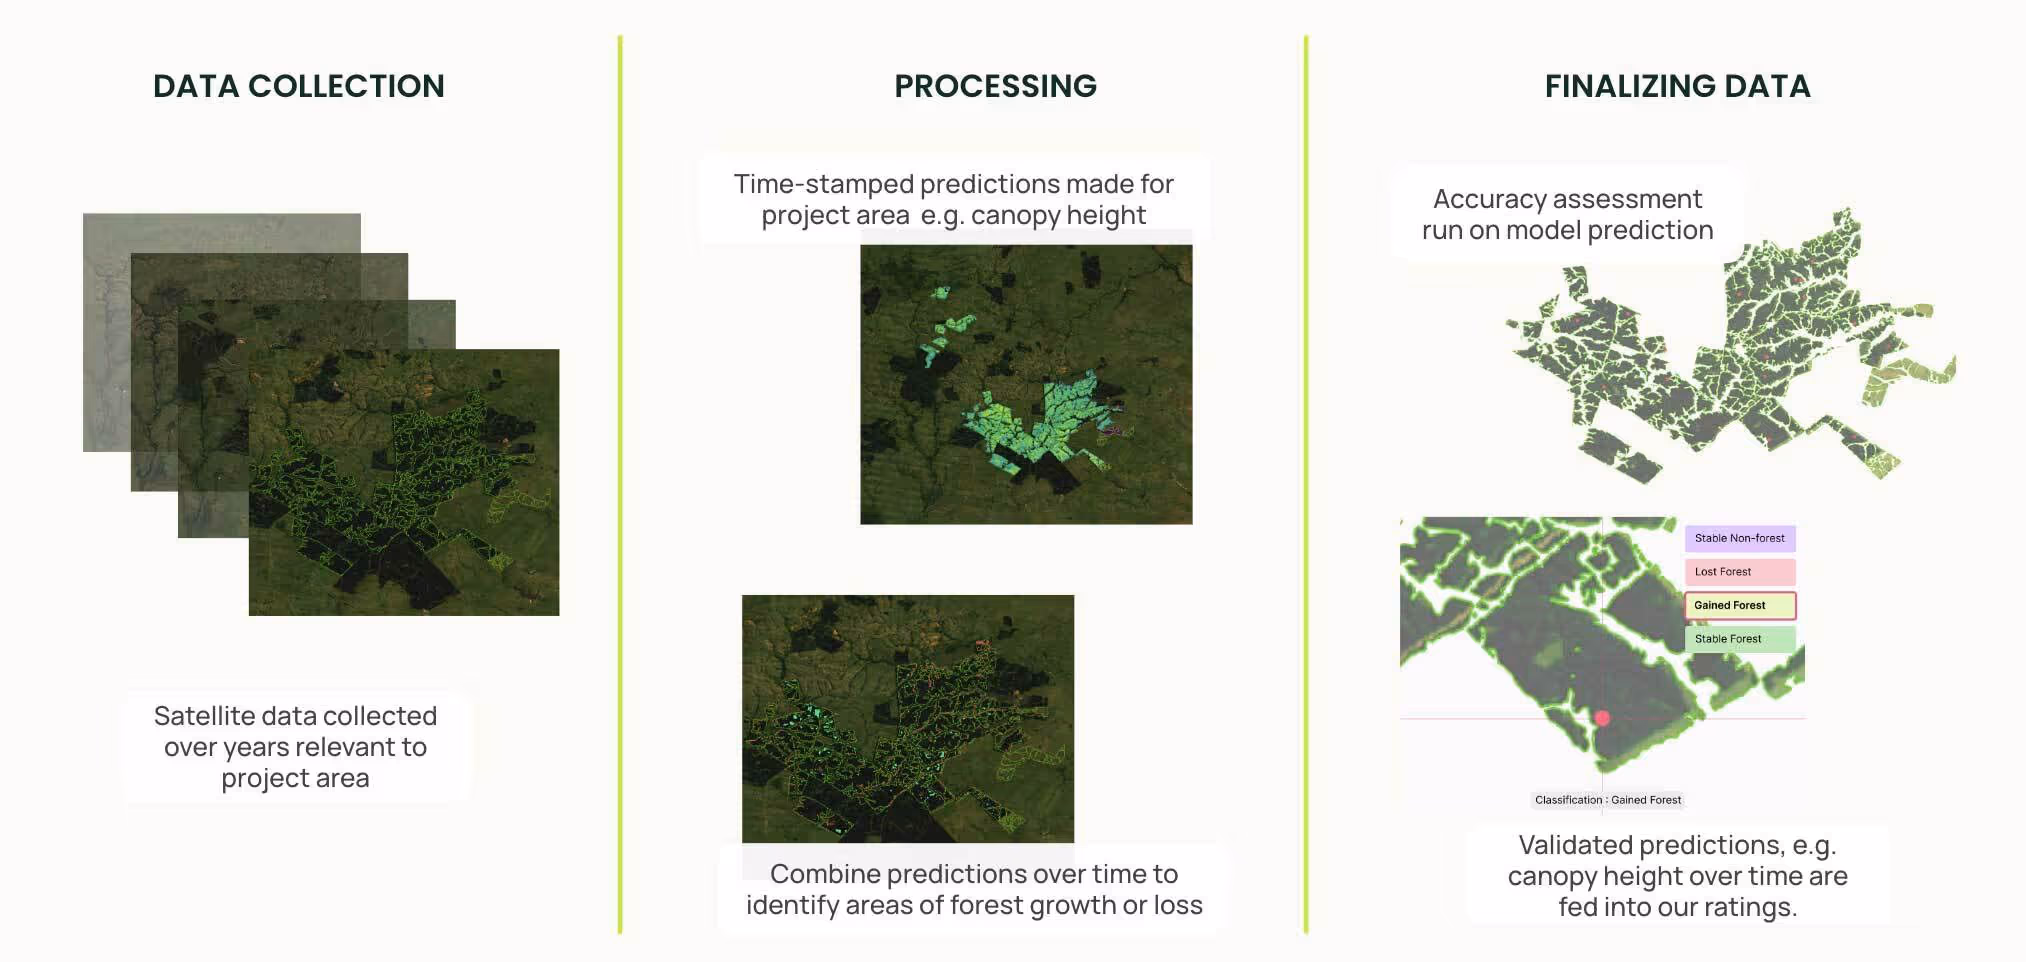
Utilizing ML allows us to see what is occurring within project areas (PA) at scale. Rather than manually sampling small areas within a project – which is time consuming and less precise – we can assess whole project areas, located anywhere in the world. In order to have the most accurate output from our ML models, we train proprietary models in specific biomes and geographies, which are used for different carbon project types.
For every PA, we create a shapefile (an outline of the project area). We use the shapefile to extract pixels from satellite imagery that falls in the project boundary (typically 10m-30m resolutions). Sylvera examines every single pixel within a PA both alone and in the context of their adjacencies (which is a powerful feature of deep learning).
For example, if we are trying to assess forest growth, we will use our ML models to estimate the canopy height of all pixels within the PA. To do this, we train a model to identify forest canopy height by feeding it tens of thousands of labeled data points. This allows the model to “learn” to identify the specific features associated with canopy height.
We then run our models on each carbon project area to estimate – in this example – the canopy height. By running the model over the same area for multiple years, we can see changes over time in the forest area.
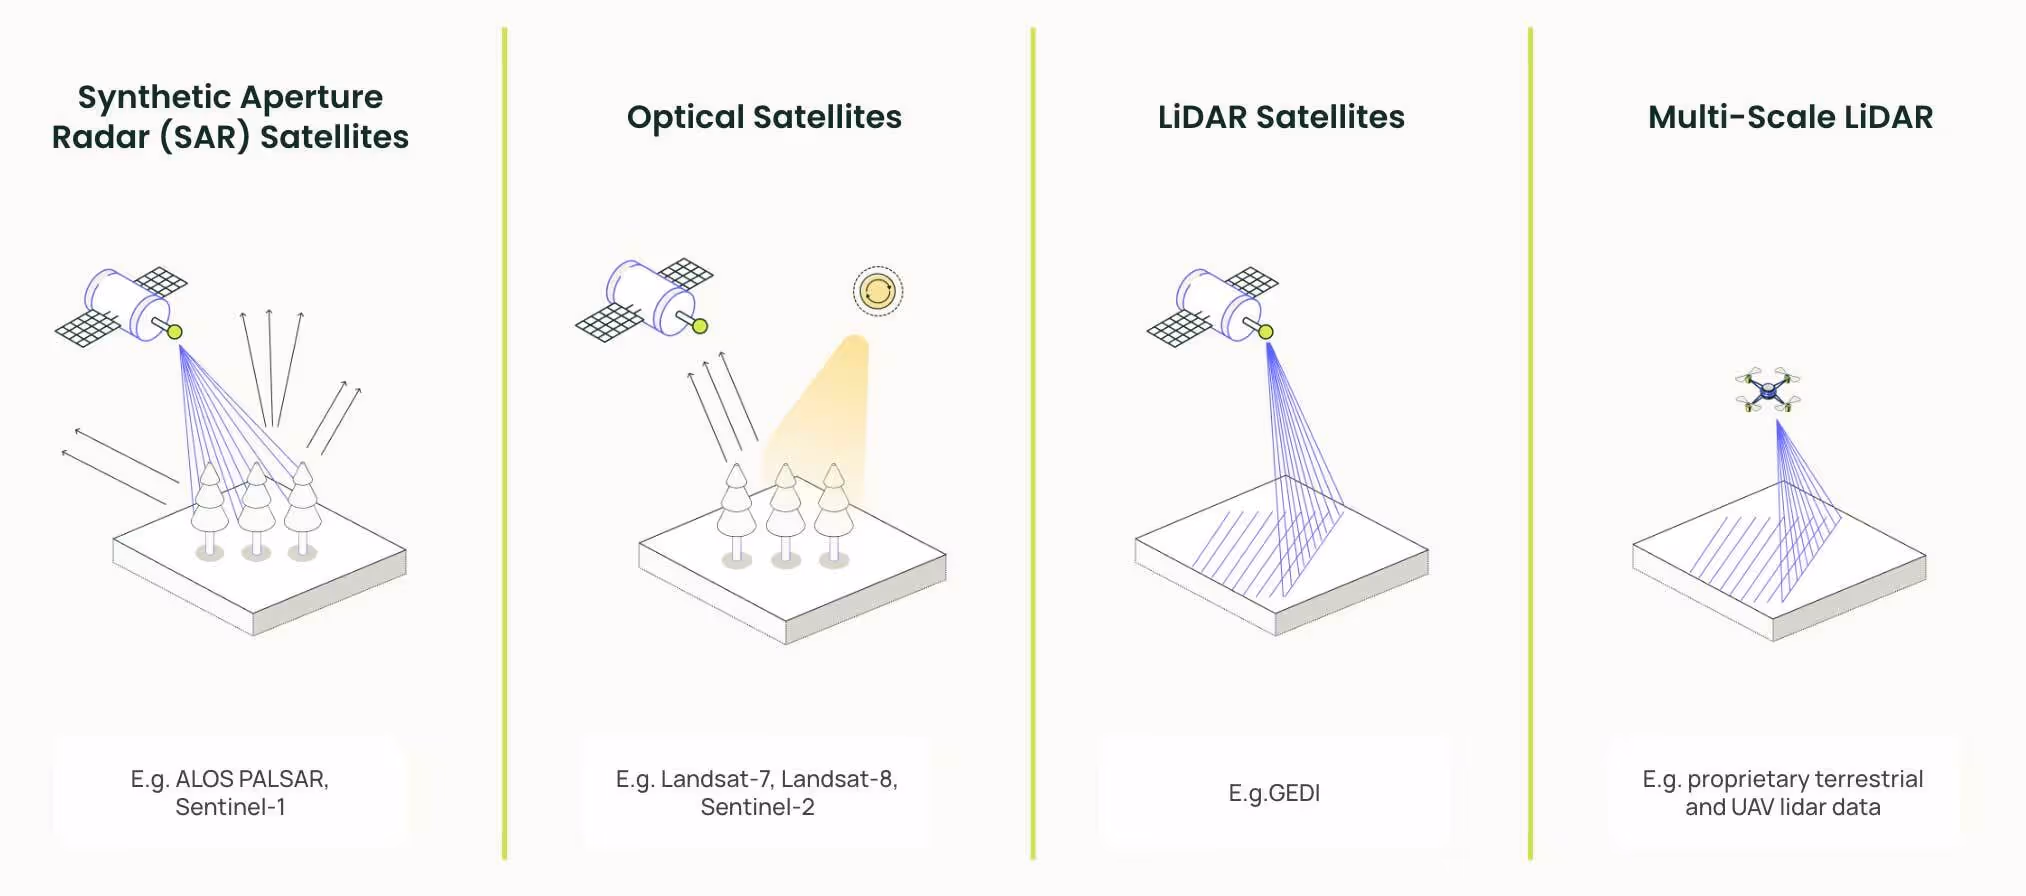
Combining multiple data sources
We utilize multiple types of data to train and run our models. Each type provides different data, which enables us to detect specific features.
How we use ML for ARR project analysis
ARR (Afforestation, Reforestation, Revegetation) projects are nature-based solutions that fall under the “removals” category. They commonly aim to convert degraded and barren land through tree planting.
To evaluate the performance of ARR projects, it is essential to identify areas of new forest growth, as well as forest loss. We use canopy height as a proxy to identify these areas.
The images on the following page illustrate how we utilize our proprietary machine learning models and satellite data to identify areas of forest growth by estimating canopy height within the ARR project areas over time.
In this example, you can see the canopy height increases in different areas of the project. This indicates areas of new forest planting and growth at different points in time.
We compare these results to the project reports to identify if they align or if there are discrepancies.
- If we identify the same area of forest growth as reported, and no unreported losses, then the carbon score will be 100%
- If we identify a smaller area of forest growth than reported, or any forest loss that is unreported, then the carbon score will be below 100%
Canopy height (yellow and green) increases in different areas of the project over time. This indicates areas of new forest planting and growth
How does this inform the Sylvera credit rating?
The results of our modeling approach are put through a quality control process to ensure that they are representative of what is actually happening on the ground within the project area, and to ensure a high accuracy in the Carbon Score.
We also use our ML results in the Additionality component of our ratings framework to test for project area ineligibility.
- If to develop a carbon offset project, a project developer has cleared any primary forest that existed prior to the project start, then the area of forest cleared is considered ineligible and represents an over-crediting risk. To help us understand this risk, we use the results from our ML to track the existence of any historic primary forest, in addition to moments in time deforestation occurred.
How we use ML for REDD+ project analysis
REDD+ (Reduce Emissions from Deforestation and Forest Degradation) projects are a common type of nature-based solution that fall within the “avoidance” category. They aim to preserve existing forests by attaching financial value to the carbon stored in forests, and adding an incentive to reduce human impact that would result in greenhouse gas emissions.
To evaluate the performance of REDD+ projects, it is necessary to identify forest loss vs. maintained forest over a period of time.
The images on the following page show how we utilize our proprietary machine learning models and satellite data to identify areas of forest loss by detecting whether an area changes from forest to non-forest within REDD+ project areas across time.
The results of our modeling approach are put through a quality control process to ensure that they are representative of what is actually happening on the ground within the project area, and to ensure a high accuracy in carbon score.
In this case, you can see that there are some areas changing from forest to non forest, indicating that forest loss has occurred within the project area over time.
We then compare these results to the project reports to identify if they align or if there are discrepancies.
- If we find that there is more forest loss than reported, then the carbon score will be below 100%. The more forest loss that is not reported, the lower the score will be.
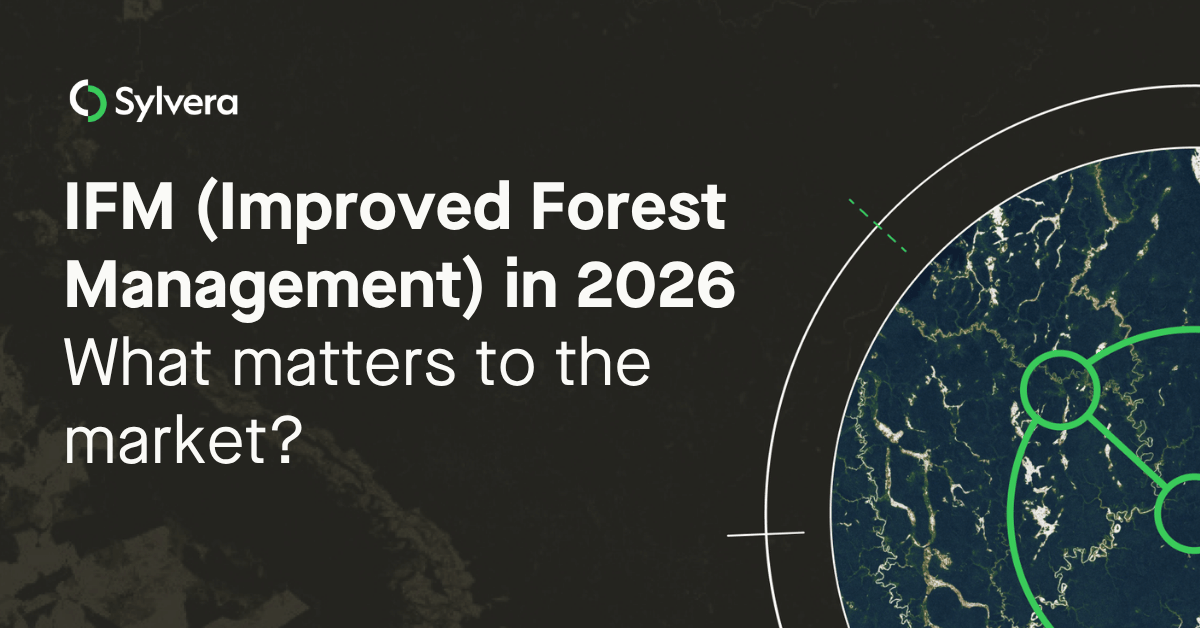
How we use ML for IFM project analysis
Improved Forest Management (IFM) is an agriculture, forestry and land-use project category. These forest management activities result in increased carbon stocks within forests and/or reduce greenhouse gas emissions from forestry activities when compared to business-as-usual forestry practices.
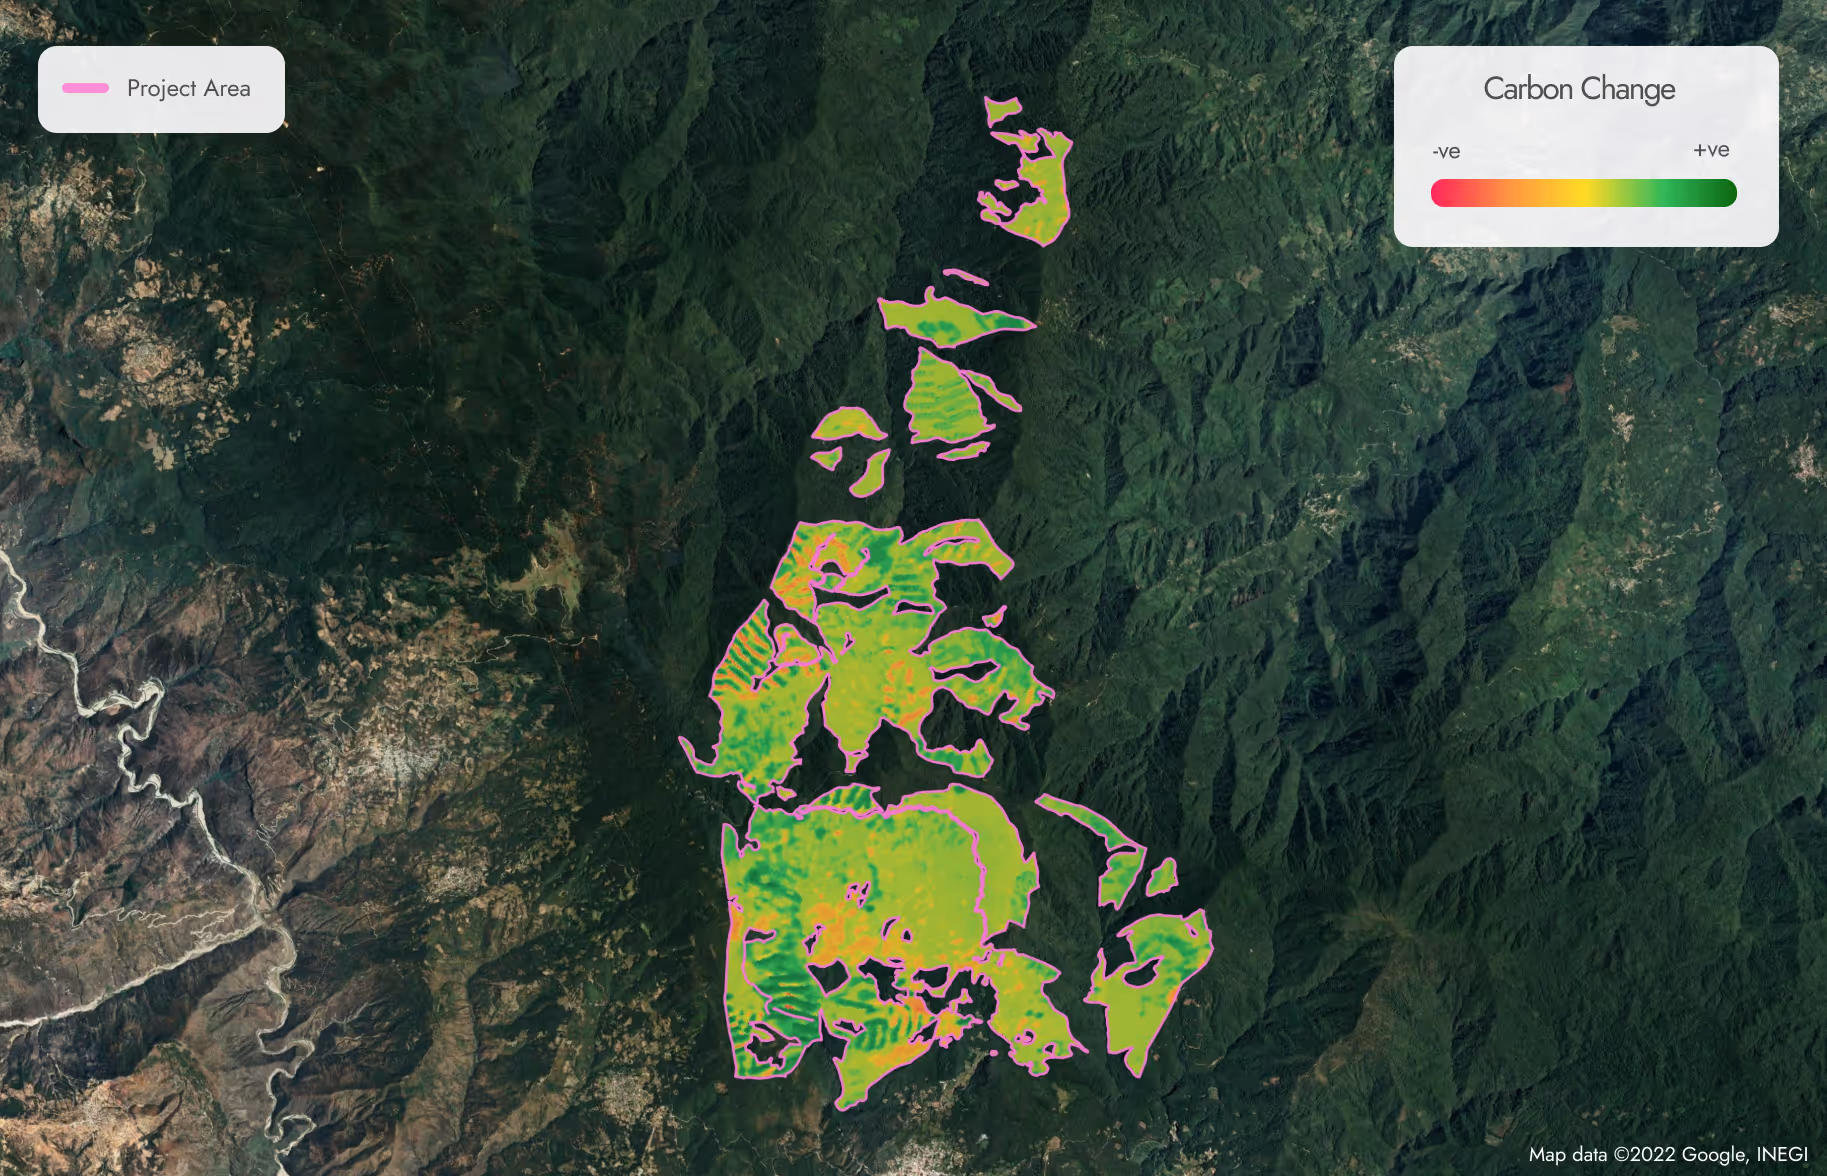
To evaluate the performance of IFM projects, we identify activities that have occurred that result in a change in carbon stock. We use canopy cover as a proxy for these activities and a combination of deep learning and regression models to identify the size of the area in which these activities have taken place.
In the image below, you can see a map indicating the relative change in forest cover in different areas of a project. These changes in forest cover will have a relative impact on the carbon stock.
How does Sylvera’s ML differ from our competitors’?
Sylvera’s machine learning expertise and capabilities gives us the ability to accurately gain information on carbon projects that others cannot. We also invest into future research streams to ensure we are always operating at the cutting edge of the industry.
In addition to classical machine learning, which assesses each data point (i.e. pixel) in isolation, Sylvera also applies deep learning algorithms, which are able to better understand image context. This enables greater accuracy in estimation and analysis, and for generalized prediction across different geographies and time periods.
Sylvera does not rely on optical data alone, but makes use of the full range of EO data available: optical, SAR/Radar, LiDAR. Soon we’ll be incorporating hyperspectral data into our methodology.
Ground Truthing Campaign
Sylvera is LiDAR scanning forests in an effort to build the world’s largest dataset of carbon stored in trees and above-ground biomass.
The quantity and quality of this LiDAR reference data is unparalleled. By collecting vast quantities of this data around the world in different biomes, it means that Sylvera can estimate both biomass and carbon stocks for forests at an unprecedented accuracy using satellite data.
.avif)
Sylvera is the only ratings platform in the world that has collected enough three dimensional forest data using LiDAR for it to be used as reference data. Today, we use this data to train and calibrate the EO-based machine learning models to improve their accuracy. This is one of our key research and development streams and will be used in our ratings in the future.