The clearest, most actionable view of the carbon market
Make informed decisions with comprehensive price data, deep country and methodology risk analysis, and expert forecasts
Everything that matters, connected
Pricing, policy, and integrity signals connected in one workspace for faster, better-informed decisions.
Quality and price signals combined
Essential data and market analysis spanning quality, price, and policy – all integrated into one dashboard.
Expert analysis, distilled for you
Our experts use consistent frameworks to translate complex data into comparable evaluations.

Stay ahead of the curve
Combine historic buyer activity, live market data and scenario-based forecasts to understand the past, present, and future of the carbon markets.
What sets our data apart
Replaces disconnected sources of market and price data with a single, decision-ready view to move at the speed you need
Typical market data

Complex markets, made clear
Expert-led analysis translates dense market data into insights you can act on immediately.
Market activities, decoded
Spot prices for 20,000 credits, buyer patterns from 40,000 retirements, and timely expert market analysis.

50+ Country and policy risks, mapped
Detailed evaluations of policy risk and mitigation strategies for over 50 countries, including tracking Article 6 activity.
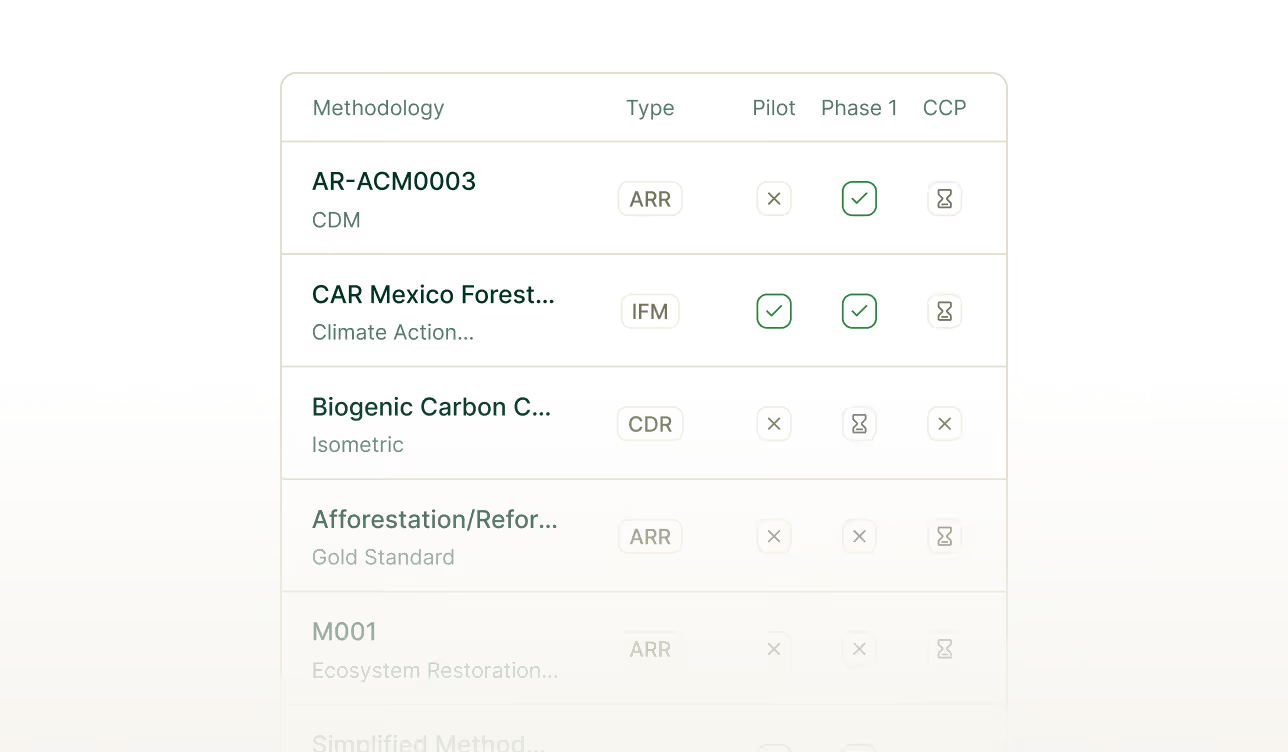
25+ Methodologies, compared
Detailed reviews of methodology strengths and weaknesses across the most relevant NBS and CDR project types.
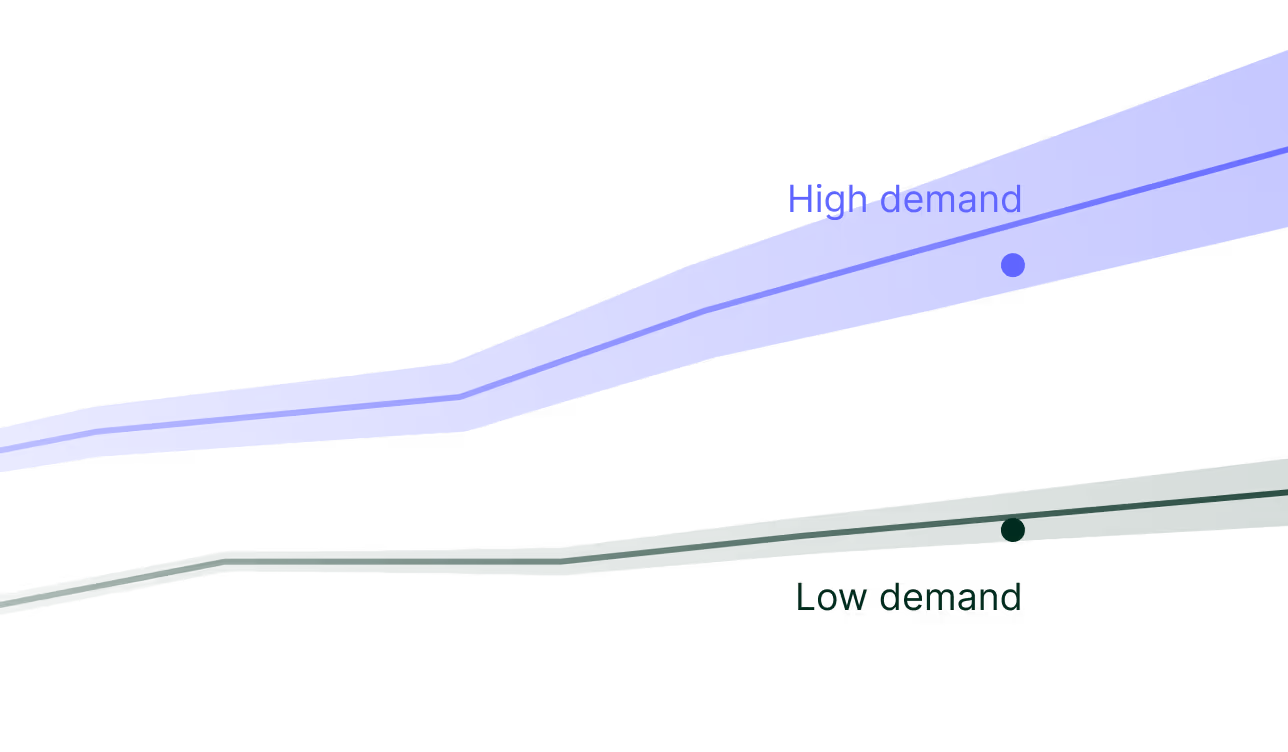
Market forecasts
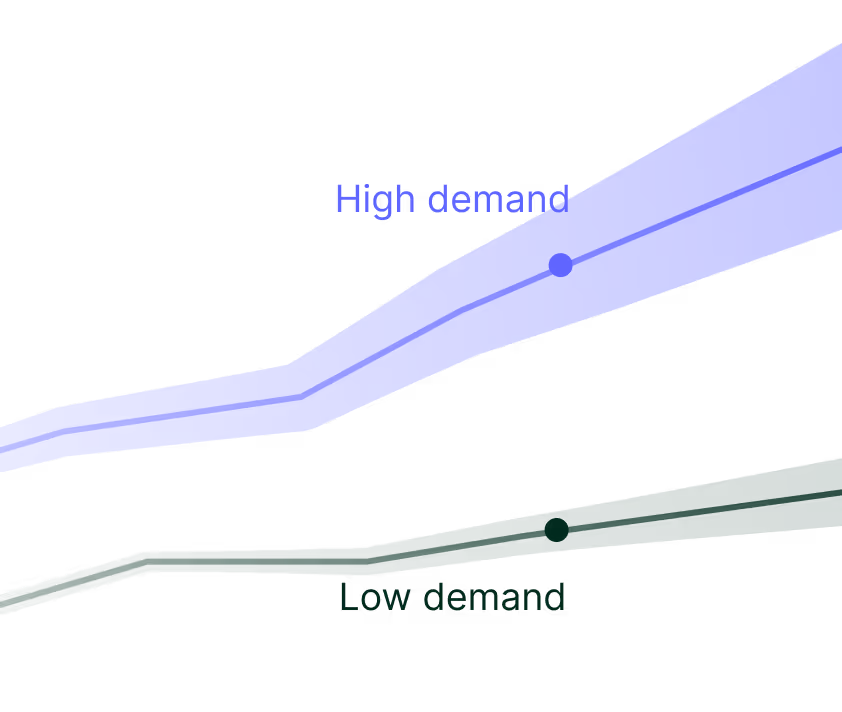
Annual price, demand and supply projections to 2050. Covering core project types and regions, under 3 demand scenarios.
Deep market coverage
Market coverage deep enough to power confident pricing, benchmarking, and strategy.
Estimates powered by 300,000+ transactions with confidence bands and backtested accuracy.

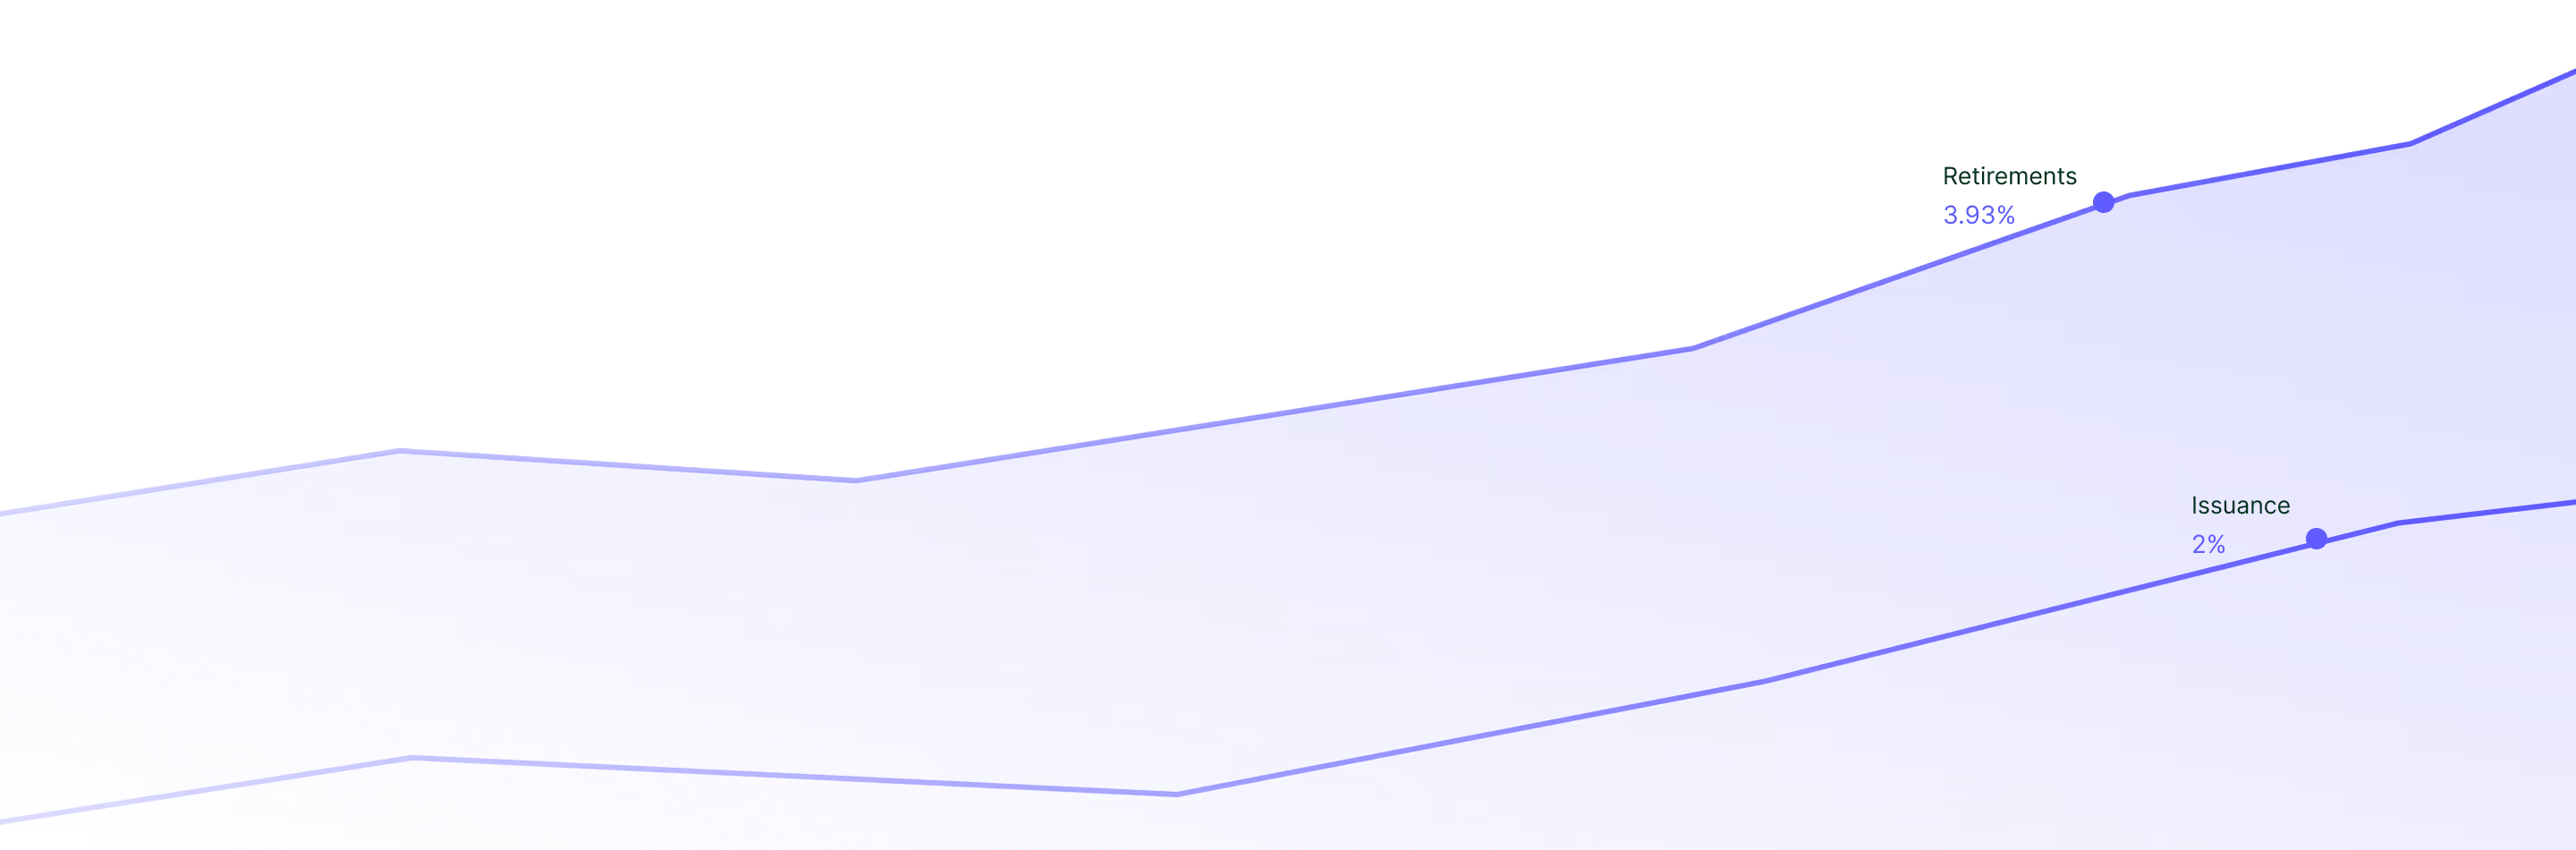
Live issuance, retirement, and pricing data from all major carbon registries.

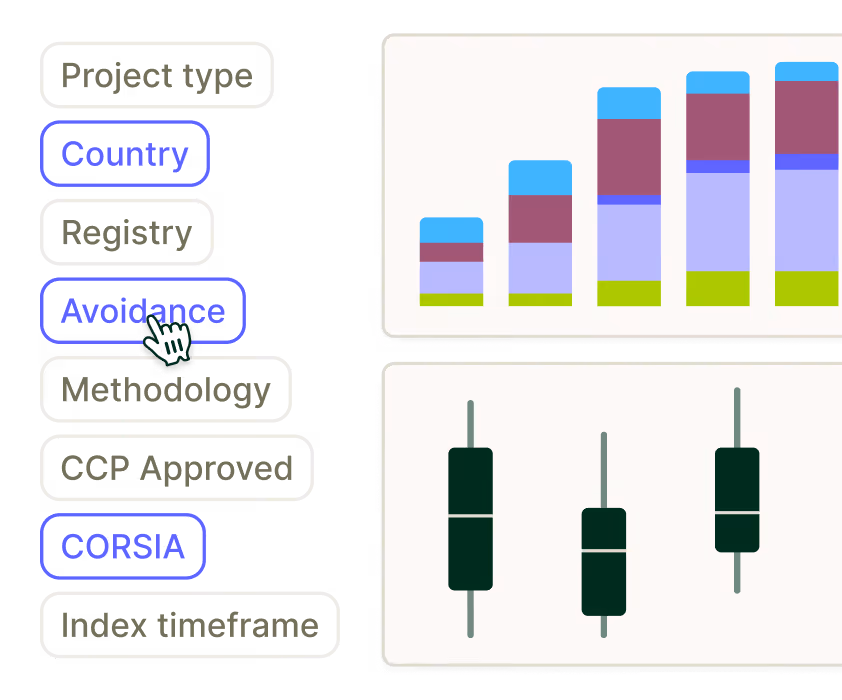
Actionable demand analysis or prospecting viewable by sector, vintage, project type, and geography.

Benchmarks across project types and vintages for valuation, negotiation, and positioning.

See Market Intel in action
From market analysis to pricing decisions – see how buyers, investors and developers use Sylvera to navigate the carbon market.
FAQs
- Risk to credit integrity: Evaluates project methodologies based on carbon accounting, additionality, permanence, safeguards, and co-benefits compared to an ideal best-practice methodology.
- Market acceptance and accreditation eligibility: Assesses alignment with key schemes like CORSIA (pilot and phase 1), CCP, ICROA, and domestic programs such as the Singapore carbon tax.
Yes, with Methodology Profiles you can compare risks across methodologies for different project types. This feature supports alignment with net-zero goals by enabling the selection of methodologies that match specific risk appetites and climate objectives, regardless of the project type focus.
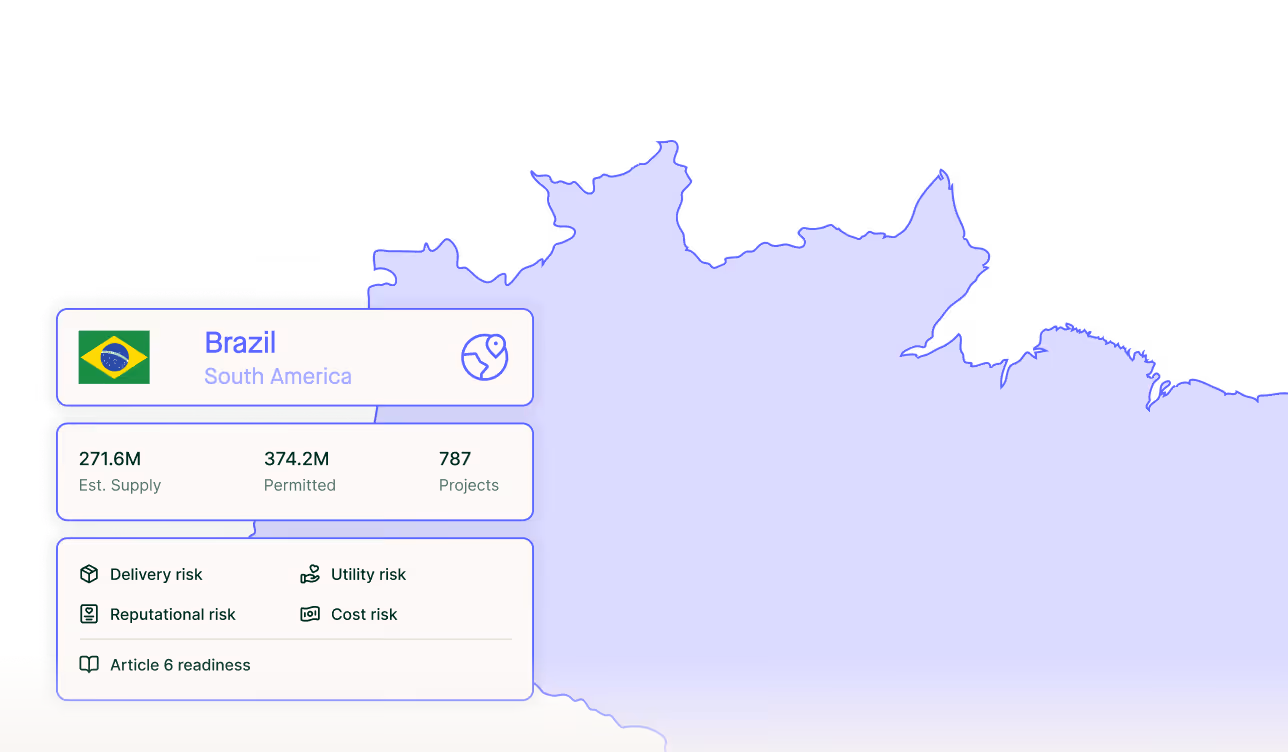
Sylvera’s Country Profiles assess the 4 major risks (delivery, utility, reputational, and cost) associated with a carbon project’s host country that carbon credit buyers and investors face, and score them on a scale from 1 (low risk) to 10 (high risk). Each risk is defined by several risk factors, including drivers such as carbon ownership rights, trading and use regulation, and LOAs/CAs experience.
By offering insights into country-specific risks, Country Profiles enable users to assess and compare potential risks projects may face in different countries. This helps in identifying regions that align with the user’s risk tolerance and net-zero strategies, allowing them to avoid high-risk areas that could compromise project success or compliance. As Sylvera monitors country developments, users can be sure their risk strategy is up to date.
Request a 7-day free trial
Explore the market and pricing data powering real-world investment and procurement decisions.