“Over the years we’ve invested significantly in our field data team - focusing on producing trusted ratings. While this ensures the accuracy of our Ratings, it doesn’t allow the scale across the thousands of projects that buyers are considering.”

For more information on carbon credit procurement trends, read our "Key Takeaways for 2025" article. We share five, data-backed tips to improve your procurement strategy.
One more thing: Connect to Supply customers also get access to the rest of Sylvera's tools. That means you can easily see project ratings and evaluate an individual project's strengths, procure quality carbon credits, and even monitor project activity (particularly if you’ve invested at the pre-issuance stage.)
Book a free demo of Sylvera to see our platform's procurement and reporting features in action.
The carbon credit market has matured significantly, and with that maturity comes a sharp reality for project developers: they can no longer rely on building quality projects in isolation.
Today's successful developers treat carbon project development like any sophisticated market entry - one backed by competitive intelligence, strategic positioning, and continuous market feedback.
The stakes are high. With 46% of pre-issuance projects failing before generating a single credit, and only 25% of existing credits meeting current buyer demand thresholds, developers need actionable market intelligence at every stage of the project lifecycle to research, benchmark, validate, uphold quality, and find buyers.
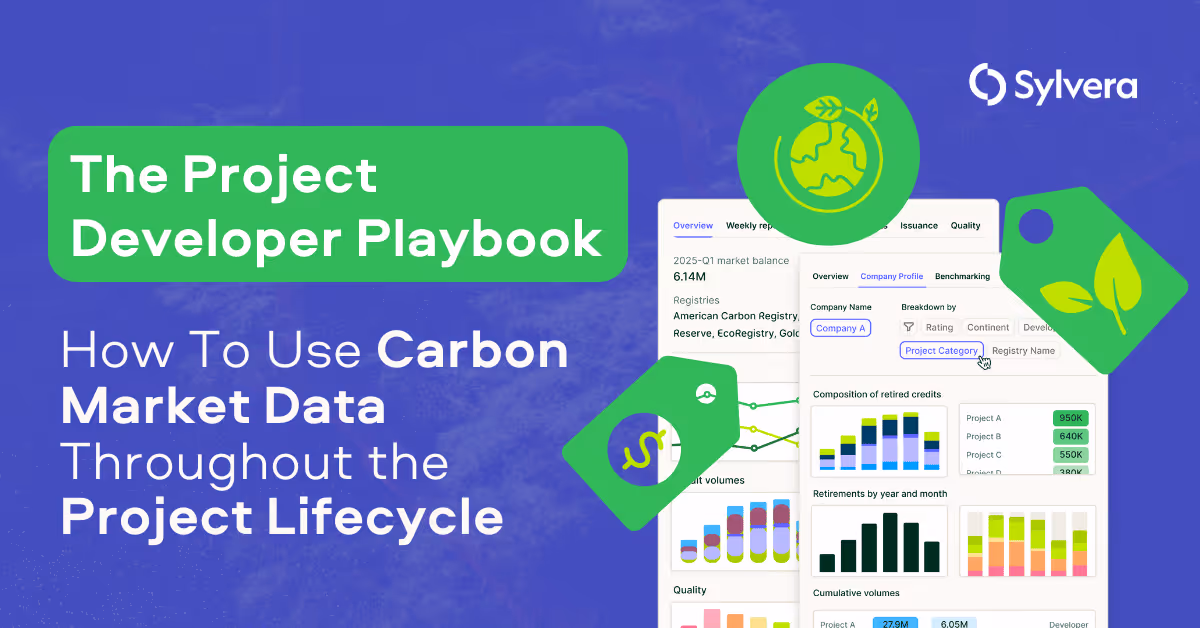
Here's how leading project developers are using carbon market data to navigate from initial project design through to successful credit sales.
Stage 1: How Do You Design Projects That Meet Buyers Where They Are?
Critical decisions happen before you register a single hectare or finalize methodology selection. Smart developers start by understanding what the market actually wants (not what they assume it wants).
Which Countries Offer the Best Risk-Return Balance?
Country selection can be complex. Developers are using Country Profiles to analyze:
- Delivery risk: Political stability, regulatory consistency, operational challenges
- Utility risk: Infrastructure limitations, access constraints
- Reputational factors: Human rights track records, governance issues
- Article 6 readiness: Institutional preparedness for international carbon markets
This matters because projects in Article 6-ready countries can access multiple market channels - from voluntary markets to CORSIA compliance to bilateral agreements under Article 6.
For example, countries like Rwanda rank in the top three in Africa for institutional preparedness, creating pathway advantages for developers. Whereas Indonesia's evolving domestic registry requirements, for example, have created uncertainty for projects that didn't monitor these developments proactively.
As part of Sylvera’s in-app Country Profiles, quarterly country risk updates help developers anticipate policy shifts that could impact project timelines or eligibility.
How Do You Choose the Right Methodology?
Methodology choice isn't just about technical fit, it enables future market access.
Developers are analyzing Methodology Profiles to understand which approaches align with emerging compliance schemes and buyer preferences. For example, a VM0042 improved forest management project faces different market dynamics than a VM0047 afforestation project, with distinct pathways to:
Data can reveal patterns. Certain methodologies consistently achieve higher ratings due to stronger additionality frameworks or more robust permanence provisions. By selecting methodologies with proven market acceptance early, developers avoid costly redesigns later.
What Market Trends Should You Track?
Regular carbon Market Commentary helps developers spot emerging opportunities before they become obvious. Early signals matter, for example
- When major airlines announce CORSIA purchasing intentions
- When new compliance schemes indicate methodology preferences
- When buyers signal co-benefit priorities
One developer recently redesigned their co-benefits measurement approach after market data showed a measurable price premium for projects with quantified biodiversity outcomes. That early adjustment translated directly to revenue gains.
Stage 2: How Do You Prove Project Quality Quickly and Credibly?
In a market increasingly competitive and skeptical of greenwashing, this has become the make-or-break challenge.
When Should You Get a Pre-Issuance Quality Assessment?
Forward-thinking developers are obtaining independent quality assessments before credits actually issue. These Pre-Issuance assessments evaluate projects across:
- Delivery probability: Will credits actually generate as projected?
- Integrity factors: Does the project meet additionality and permanence standards?
- Market value potential: How will buyers perceive this project?
More importantly, these assessments come with remedial actions: specific, actionable recommendations for closing quality gaps.
Rather than discovering issues after credit issuance (when it's too late), developers can:
- Address permanence risks with enhanced monitoring
- Strengthen additionality arguments with better baseline analysis
- Improve verification approaches while still in development
This proactive validation strengthens funding cases substantially. When approaching investors, developers can demonstrate not just commitment to quality, but verified quality credentials from a recognized rating agency.
How Does Your Project Compare to Competitors?
Understanding your project's quality in isolation is insufficient. Developers need context:
- How does your ARR project in Kenya compare to similar projects?
- What drives the quality differential between BBB and AAA rated improved forest management initiatives?
- Which specific factors influence rating outcomes most?
By analyzing detailed rating breakdowns across a catalog of thousands of projects, developers identify specific levers that influence quality scores. Is it the monitoring approach? The additionality methodology? The permanence safeguards?
This intelligence transforms quality improvement from guesswork into strategic, data-driven prioritisation.
Stage 3: How Should You Price Your Credits?
Pricing is where theoretical quality meets market reality. Pricing insights consistently rank as developers' top concern, and for good reason. Pricing mistakes can cost millions in lost revenue.
What Premium Does Quality Actually Command?
Our Market Intelligence suite includes aggregation and analysis of 300,000+ price points, revealing clear patterns, with some examples below.
Quality Premiums Vary by Project Type
- AAA-rated biochar projects: ~40% premium over BBB-rated equivalents
- AAA-rated cookstove projects: ~25% premium over BBB-rated equivalents
- Forestry projects: Premiums vary significantly by methodology and region
Co-Benefits Create Additional Price Lift
Projects with verified biodiversity or community outcomes capture premiums that justify the additional monitoring costs. The data helps developers make informed decisions about which quality enhancements generate ROI.
Do Geography and Vintage Really Matter for Pricing?
Yes, and the patterns are consistent:
Regional Dynamics
Africa-based ARR projects consistently command higher prices than comparable South American projects. This pattern influences geographic strategy for developers with flexibility in project location.
Vintage Preferences Are Narrowing
Buyers increasingly focus on credits from the past 3-5 years. Recent vintages command significant premiums over 2018-2019 credits. This intelligence helps developers:
- Time credit issuance strategically
- Structure off-take agreements around vintage preferences
- Plan project pipelines with vintage demand in mind
What Are Major Buyers Actually Paying?
Off-take data tracking public transactions reveals what major buyers actually pay (not what brokers claim).
When Microsoft commits to 18 million tons of durable carbon removals at specific price points, that creates pricing benchmarks for similar project types. When British Airways becomes the largest airline purchaser through a 33,000-ton purchase, the pricing signals inform market expectations.
Developers can model revenue scenarios using these real-world transactions rather than optimistic assumptions.
Stage 4: How Do You Find the Right Buyers?
Building a great project is important. Finding the right buyers is vital. Market Intelligence transforms buyer identification from networking luck into strategic targeting.
Which Companies Actually Buy Your Project Type?
Tracking retirement patterns across 39,000+ companies reveals which industries and specific corporations favor particular project types.
For example, if you're developing an improved forest management project in Southeast Asia, you can identify:
- Which consumer goods companies have retired similar credits
- Which airlines prioritize forestry projects
- Which technology firms match your project profile
This creates a targeted prospect list of high-probability buyers rather than generic outreach.
What Do Different Industries Prefer?
Industry-level patterns emerge clearly:
- Financial services: Strong preferences for removal projects
- Manufacturing firms: Often prioritize avoided emissions with clear co-benefits
- Technology companies: Increasingly favor durable carbon removal
- Airlines: CORSIA-eligible credits with specific vintage requirements
This intelligence focuses developer outreach efforts on prospects most likely to convert to buyers.
Can You Connect Directly with Buyers?
Rather than navigating broker networks and losing margin to intermediaries, developers are accessing Connect to Supply - a platform that connects developers directly with buyers issuing RFPs for specific project types.
So, when a major corporation specifies requirements through this platform - geography, methodology, vintage, quality threshold - developers meeting those criteria can respond directly, bypassing traditional distribution channels.
Benefits of Direct Engagement:
- Improved project economics (no intermediary fees)
- Real-time market feedback on buyer preferences
- Direct relationships with end purchasers
- Faster transaction cycles
And, if multiple RFPs specify certain quality thresholds or co-benefit requirements, developers gain real-time insight into evolving buyer preferences.
Stage 5: How Do You Maintain Performance Over Time?
Project development doesn't end at credit issuance. Ongoing monitoring serves multiple purposes that compound over time.
What Should You Track Post-Issuance?
Quarterly monitoring helps developers:
- Track performance against initial projections
- Identify emerging risks before they become problems
- Maintain investor confidence through transparent reporting
- Document lessons learned for future projects
How Does Performance Data Inform Future Projects?
And performance data feeds back into the cycle - informing decisions about:
- Geographic expansion strategies
- Methodology refinements based on field results
- Resource allocation across project portfolios
- Risk mitigation approaches that actually work
Developers building project portfolios use this intelligence to optimize their overall approach based on what's actually working in the field, not theoretical assumptions.
Why Does Market Intelligence Create Competitive Advantage?
The gap between successful and struggling developers increasingly comes down to information asymmetry.
Developers with comprehensive market data make better decisions at every stage:
- ✓ Design projects aligned with actual buyer demand
- ✓ Validate quality before expensive development mistakes
- ✓ Price credits competitively based on real market data
- ✓ Target buyers most likely to purchase
- ✓ Refine approaches based on performance intelligence
As the carbon markets continue professionalizing, this intelligence will become table stakes. The developers who integrate market data into their workflows now will build sustainable competitive advantages that compound over time.
Try the platform for free
If you're not already a Sylvera user, you can try out some of the tools in the free-to-access version of our platform.
Book a 1-2-1 demo
Or, book a 1-on-1 demo with our team, where we can focus on your specific use cases.