





“Over the years we’ve invested significantly in our field data team - focusing on producing trusted ratings. While this ensures the accuracy of our Ratings, it doesn’t allow the scale across the thousands of projects that buyers are considering.”

For more information on carbon credit procurement trends, read our "Key Takeaways for 2025" article. We share five, data-backed tips to improve your procurement strategy.

One more thing: Connect to Supply customers also get access to the rest of Sylvera's tools. That means you can easily see project ratings and evaluate an individual project's strengths, procure quality carbon credits, and even monitor project activity (particularly if you’ve invested at the pre-issuance stage.)
Book a free demo of Sylvera to see our platform's procurement and reporting features in action.
There is a lot of optimism about low-emission ammonia right now, and much of it is justified. Industry estimates suggest around 43 million tonnes of low-emission and transitional capacity could be operating by 2030.
But almost all of this discussion sorts plants into buckets by technology. The market talks in colours: green for renewable electrolysis, blue for fossil production with carbon capture, grey for everything unabated. Every one of these labels describes how the ammonia is made.
None of them tells you what it emits.
That worked fine when nobody was pricing the difference but it doesn't work anymore. The buyers and regulators that matter have stopped asking how ammonia is made - and started asking what its carbon intensity is.
The overlapping labels problem
We estimate carbon intensity for 318 operating ammonia facilities across 58 countries in Sylvera Commodities Insights, plus more than 350 facilities in the development pipeline. When you line the facilities up by their estimated CI rather than their technology label, the buckets - green, blue, grey - leak into one another.

Electrolysis facilities, labelled as 'green', span 0.08 to 0.92 tCO₂e per tonne of ammonia. That’s more than an 11-fold spread within the label, driven largely by the electricity source feeding the electrolyser.
The ranges overlap between 'blue' carbon capture and 'grey' conventional facilities too. Operating carbon capture facilities span 1.60 to 3.11 tCO₂e/t, while conventional fossil production spans 2.56 to 5.23 tCO₂e/t (fig. 1). Technology labels cannot reliably separate between electrolysis, capture-equipped and unabated plants, and buyers cannot price the difference between products on a label alone.
None of this makes the technology categories wrong. The medians behave as expected: electrolysis at 0.56, capture-equipped at 1.67, conventional at 2.87. It just means the category tells you where a plant probably sits, and probability is not what a compliance obligation is settled against.
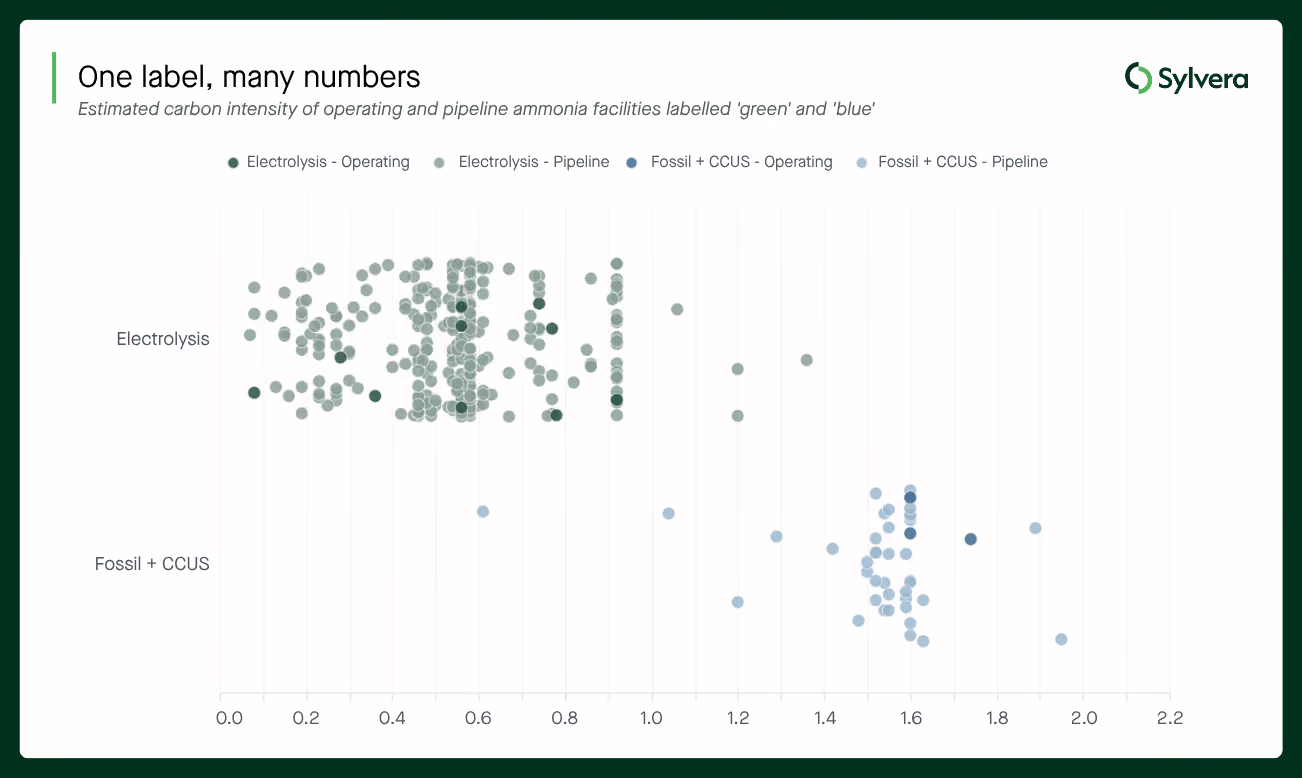
Figure 1: Electrolysis facilities span 0.07 to over 1.3 tCO₂e/t, driven largely by electricity sourcing, while the cleanest capture-equipped projects undercut many electrolysis plants. Conventional fossil production sits at 2.56 to 5.23, beyond the right of this scale, and one operating capture facility at 3.11 is also off-scale. Three pipeline electrolysis facilities above 1.8 are excluded as outliers.
Source: Sylvera Commodities Insights, July 2026.
Pricing on carbon intensity, not technology labels
So which mechanisms are revealing this flaw in technology type labels that the market currently transacts on?
Three mechanisms with material impact on both ammonia supply and demand are the EU's Carbon Border Adjustment Mechanism (CBAM), Japan's contracts-for-difference (CfD) scheme under the Hydrogen Society Promotion Act, and the EU's Renewable Energy Directive (RED III), which mandates rising demand for renewable fuels of non-biological origin (RFNBOs).
These schemes price and gate on verified carbon intensity, not labels, requiring strong technical documentation to prove entry into new compliance markets, where marginal differences in emissions reductions matter.
CBAM prices carbon intensity continuously.
Since January 2026, every tonne of ammonia imported into the EU carries a cost tied directly to its verified embedded emissions, priced against the EU ETS. A facility at 2.6 tCO₂e/t simply costs its importer less than one at 3.4, and that cost gap grows each year as the charge phases in.
The Commission's July 2026 ETS revision proposes softening the schedule, holding a residual 15% of free allocation from 2034 and pushing full CBAM exposure to 2038, but the destination is unchanged and the slower ramp only extends the window in which cleaner suppliers can lock in EU market share.
Read our take: The EU ETS Revision: What It Means for the Commodity Market
The rule that matters most for producers is unchanged too: only verified carbon intensity counts. Importers without verified figures pay default values set at country-average intensity plus a mark-up, which means an unverified clean plant is priced exactly like a dirty one.
Japan's Contracts for Difference scheme gates on carbon intensity.
Japan's Hydrogen Society Promotion Act sets a hard eligibility ceiling of 0.87 kgCO₂e per kg of ammonia (equivalent to 0.87 tCO₂e/t, measured well-to-gate), roughly 70% below conventional production. No project above this threshold can receive its contracts-for-difference price support, whatever the technology.
The scheme has moved from paper to portfolio over the past year, and its awards show exactly what a numeric gate looks like in practice: METI has now backed 'blue' ammonia from Louisiana for JERA and Mitsui alongside 'green' electrolysis-based ammonia from ACME and IHI's Gopalpur project in India. The scheme is colour-blind by design. Clear the threshold and the pathway is irrelevant; miss it and no label helps.
RFNBO gates lower still, and carbon intensity alone is not enough.
To count as an RFNBO, ammonia must deliver a 70% lifecycle emissions saving against the EU's fossil comparator, which works out to just over0.5 tCO₂e per tonne, and the electricity feeding the electrolyser must separately satisfy the additionality and correlation rules on how and when it was generated. A facility can therefore hold a qualifying CI and still fail on its power sourcing.
Those electricity rules are currently under review, with the Commission bringing forward a reassessment originally scheduled for 2028 and now expected this autumn, and industry lobbying hard for simplification. Producers should note what is and is not in play: the sourcing tests may loosen at the margins, but the emissions threshold itself is not being reopened. RFNBO status remains the entry ticket to the EU's binding industrial hydrogen targets, the deepest pool of mandated demand in the market.
So the market has split in two. There is a priced market, where every facility selling into the EU competes and every 0.1 tCO₂e/t of verified advantage is worth money against the plants it trades against. And there is a gated market, where support schemes and mandates create premium demand below a hard line, and only projects designed with those requirements in mind can reach it.
Screening the ammonia market
Navigating either market starts with visibility. Buyers and producers need facility-level carbon intensity across the competitive landscape to see who qualifies for what, and at what margin. Sylvera provides estimated carbon intensity at the facility level for exactly this purpose. We screened our estimates against the thresholds of these three mechanisms to see how many facilities could be eligible. 1
For production facilities in operation today:
- All 318 operating facilities selling into the EU face carbon pricing on their number, through the EU ETS for domestic producers and CBAM for imports. 155 sit below the global median of 2.84 tCO₂e/t, and every one of those holds a continuous, monetizable carbon-cost advantage over the half that doesn't. Only 8 operating facilities outside the EU sit below the CBAM benchmark for ammonia of 1.522 tCO₂e/t, the level beneath which an importer accrues no certificate cost.
- 11 operating facilities sit at or below Japan's gate of 0.87 tCO₂e/t, though the value runs through Japanese offtakers, since the CfD supports the buying side.
- 3 operating facilities sit at levels consistent with the RFNBO threshold, before the electricity-sourcing rules on additionality and hourly matching are applied.
Of the 361 pipeline facilities we hold CI estimates for:
- All would enter below today's operating median of 2.84 tCO₂e/t.
- 286 non-EU projects sit below the CBAM benchmark of 1.522 tCO₂e/t, meaning their tonnes would accrue no certificate cost for an EU importer at all today.
- 291 pipeline facilities (81% of the pipeline) sit at or below Japan's 0.87 gate.
- 68 sit below the RFNBO threshold before electricity-sourcing rules are applied. This screen is likely conservative: RFNBO accounting assigns zero emissions to electricity that passes the sourcing rules, so facilities our estimates place above the threshold on grid-based power could still qualify with compliant renewable supply.
The current scarcity of qualifying supply is unlikely to persist. Eleven operating plants clear Japan's gate today; roughly 350 qualifying projects are in development, and the premium attached to gated demand will narrow as they are built. The CBAM position moves in the opposite direction, with the cost of carbon intensity rising on a published schedule through 2038. Both dynamics settle on verified numbers rather than technology labels. For producers, the practical consequence is timing: the value of a verified carbon intensity figure is dependent on how few others have one, and that count is rising.
Facility carbon intensity figures are Sylvera estimates from Commodities Insights, July 2026, covering operating and pipeline facilities. Explore the data with a free account, get started here.
View Sylvera’s Ammonia Carbon Intensity Framework here.
1Our threshold comparisons are indicative screens against scheme levels, not eligibility determinations under each scheme's own methodology or system boundary.


