"A lo largo de los años hemos invertido mucho en nuestro equipo de datos de campo, centrándonos en la elaboración de calificaciones fiables. Si bien esto garantiza la precisión de nuestras valoraciones, no permite la escala a través de los miles de proyectos que los compradores están considerando."

Para más información sobre las tendencias en la adquisición de créditos de carbono, lea nuestro artículo"Key Takeaways for 2025". Compartimos cinco consejos basados en datos para mejorar su estrategia de adquisición.
Una cosa más: los clientes de Connect to Supply también tienen acceso al resto de herramientas de Sylvera. Esto significa que puede ver fácilmente las calificaciones de los proyectos y evaluar los puntos fuertes de cada uno de ellos, obtener créditos de carbono de calidad e incluso supervisar la actividad del proyecto (sobre todo si ha invertido en la fase previa a la emisión).
Reserve una demostración gratuita de Sylvera para ver en acción las funciones de adquisición y elaboración de informes de nuestra plataforma.
Comprender el precio de los créditos de carbono es complejo. Una sola cotización sólo cuenta una parte de la historia. Los precios por sí solos no reflejan ni deben reflejar la complejidad de las decisiones de compra.
¿Por qué? Porque la tarificación del carbono es intrínsecamente ruidosa. Detrás de cada precio se esconde una pila de variables: calidad del proyecto, elegibilidad política, riesgo de entrega, beneficios colaterales, momento del mercado.
El éxito significa tratar el precio como una señal que necesita contexto, no como un punto final para la toma de decisiones. Por eso, los compradores más sofisticados han aprendido a aplicar tres lentes fundamentales a la hora de evaluar oportunidades:
- Evaluación de la integridad
- Mapa de admisibilidad
- Análisis de la demanda real
Al pensar en los precios de esta manera antes de actuar, consiguen créditos de mayor calidad aun valor de mercado justo, al tiempo que evitan los riesgos financieros y de reputación que preocupan a otros compradores.
Para conocer los datos más recientes sobre los precios, la calidad y las tendencias de la demanda de créditos de carbono, consulte nuestro completo informe sobre el estado de los créditos de carbono.

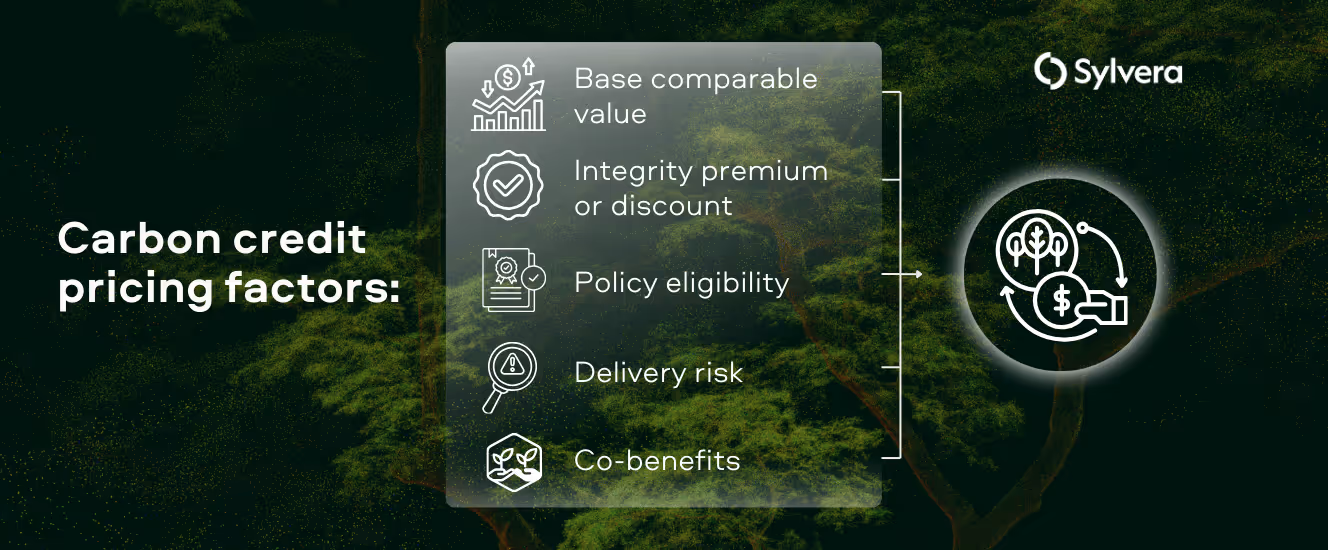
¿Qué factores controlan el precio de los créditos de carbono?
Todos los precios de los créditos de carbono contienen primas y descuentos que reflejan la percepción del valor y el riesgo por parte del mercado. Comprender estos niveles es esencial para tomar decisiones de compra bien fundadas.
El valor de base comparable es el coste fundamental de la eliminación o evitación de carbono para un tipo de proyecto y una geografía determinados. Los proyectos de forestación en Asia pueden rondar los 14 dólares por tonelada como valor de referencia, mientras que proyectos similares en Norteamérica rondan los 24 dólares por tonelada, debido a los mayores costes de ejecución y a los diferentes entornos normativos.
La prima o el descuento por integridad reflejan la confianza del mercado en la capacidad de un proyecto para generar los beneficios reclamados. Nuestros datos muestran que los compradores pagan 5 dólares más por banda de calificación para los proyectos ARR bien calificados y 2 dólares por banda de calificación para los proyectos REDD+. Esto se debe a la voluntad de los compradores de pagar más por créditos respaldados por una evaluación rigurosa e independiente.
La elegibilidad política crea variaciones significativas de precios en función del cumplimiento. Los créditos elegibles para CORSIA o alineados con las vías del artículo 6 se negocian con primas que pueden alcanzar el 150% por encima de las alternativas no elegibles, ya que la oferta limitada satisface la demanda concentrada de los compradores impulsados por el cumplimiento.
Los ajustes por riesgo de entrega tienen en cuenta la probabilidad de que los créditos prometidos se emitan y retiren realmente. Los proyectos con plazos de desarrollo más largos, procesos de aprobación complejos o exposición a la inestabilidad política se negocian con descuentos que reflejan estas incertidumbres.
Las primas por cobeneficios recompensan los proyectos que ofrecen resultados medioambientales y sociales adicionales más allá del impacto del carbono. Los proyectos que apoyan la conservación de la biodiversidad, el desarrollo comunitario o los objetivos de desarrollo sostenible obtienen precios más altos de los compradores que buscan una alineación de impacto global.
El reto consiste en separar estos factores para comprender qué impulsa las diferencias de precios.
Cartografía de la elegibilidad: ¿Cómo modifican los cambios políticos el valor de los créditos?
Los marcos políticos que rigen la elegibilidad de los créditos de carbono siguen evolucionando, creando tanto oportunidades como riesgos. Estos cambios alteran fundamentalmente el poder de fijación de precios de las distintas categorías de créditos.
La aplicación del artículo 6 representa quizá el cambio pendiente más significativo. A medida que los países desarrollen sus NDC y sus procesos de autorización, categorías enteras de créditos podrían pasar de mercados voluntarios a marcos de cumplimiento. Por otra parte, algunas podrían dejar de ser aptas para la transferencia internacional.
Los proyectos en países que restringen las autorizaciones del artículo 6 verán sus créditos excluidos de importantes segmentos de compradores, mientras que los que obtienen autorizaciones pueden obtener primas sustanciales.
CORSIA también modifica la dinámica del mercado a medida que se amplía su aplicación. La transición de la primera fase a la plena aplicación afectará a los créditos que pueden acogerse a ella, creando ganadores y perdedores basados en criterios técnicos de elegibilidad que muchos participantes en el mercado no comprenden plenamente hasta que los precios ya se han movido.
Consulte nuestro reciente Informe sobre modelos de escenariosCORSIA para ver cómo trazamos los precios, la oferta y la demanda futuros del mercado.

Estos cambios políticos pueden alterar los precios de categorías enteras de proyectos. Un proyecto que no goce del favor de los programas de cumplimiento puede ver cómo se evapora la demanda, mientras que otros pueden experimentar subidas de precios a medida que la oferta limitada satisface la demanda concentrada.
Comprender esta dinámica requiere un seguimiento continuo de la evolución de la normativa, traduciendo los cambios políticos en implicaciones reales para la elegibilidad y la fijación de precios de los créditos.
Entender la demanda: ¿Qué señales de la demanda importan realmente?
Las señales de precios en los mercados de carbono reflejan a menudo la especulación, el posicionamiento de los intermediarios o una información obsoleta, en lugar de la auténtica demanda del comprador final.
Distinguir las pautas reales de la demanda del ruido del mercado es crucial para tomar decisiones de compra.
La actividad de retirada proporciona la señal más clara de demanda genuina. Cuando las empresas retiran créditos por sus compromisos de sostenibilidad, eliminan la oferta del mercado de forma permanente. El seguimiento de las pautas de retirada por tipo de comprador, categoría de proyecto y calendario revela dónde se concentra la demanda real y cómo evolucionan las preferencias de los compradores.
El análisis de los compradores designados va más allá de los datos agregados de retiradas para comprender quién está comprando tipos específicos de créditos. Cuando Microsoft retira sistemáticamente créditos forestales de alta calidad o cuando las empresas de aviación concentran sus compras en proyectos CORSIA, estos patrones indican una demanda clara que respalda las primas de precios.
Los ratios de emisiones frente a retiradas ponen de manifiesto los desequilibrios entre la oferta y la demanda antes de que se reflejen plenamente en los precios. Los tipos de proyectos en los que las retiradas superan sistemáticamente a las nuevas emisiones se enfrentan a limitaciones de la oferta que hacen subir los precios, mientras que las categorías con crecientes excedentes de existencias pueden experimentar precios a la baja.
La información del directorio de compradores revela dinámicas de mercado que los datos de precios agregados no pueden mostrar. Comprender qué sectores impulsan la demanda de añadas, zonas geográficas y metodologías específicas permite orientar con mayor precisión las estrategias de compra y predecir mejor la evolución futura de los precios.
Comprender la demanda resulta especialmente valioso durante la volatilidad del mercado. Distinguir entre variaciones temporales de los precios y cambios fundamentales en el comportamiento de los compradores puede marcar la diferencia entre una compra oportunista y costosos errores.
¿Cómo puede la inteligencia de mercado resolver la fragmentación de datos sobre precios?
Los enfoques tradicionales para conectar y comprender todo lo anterior requieren coser información de múltiples fuentes: proveedores de calificaciones, proveedores de datos de mercado, fuentes de noticias, búsquedas en registros. Pero esto deja lagunas e incoherencias, además de consumir mucho tiempo. La velocidad y la calidad de la toma de decisiones se ven mermadas.
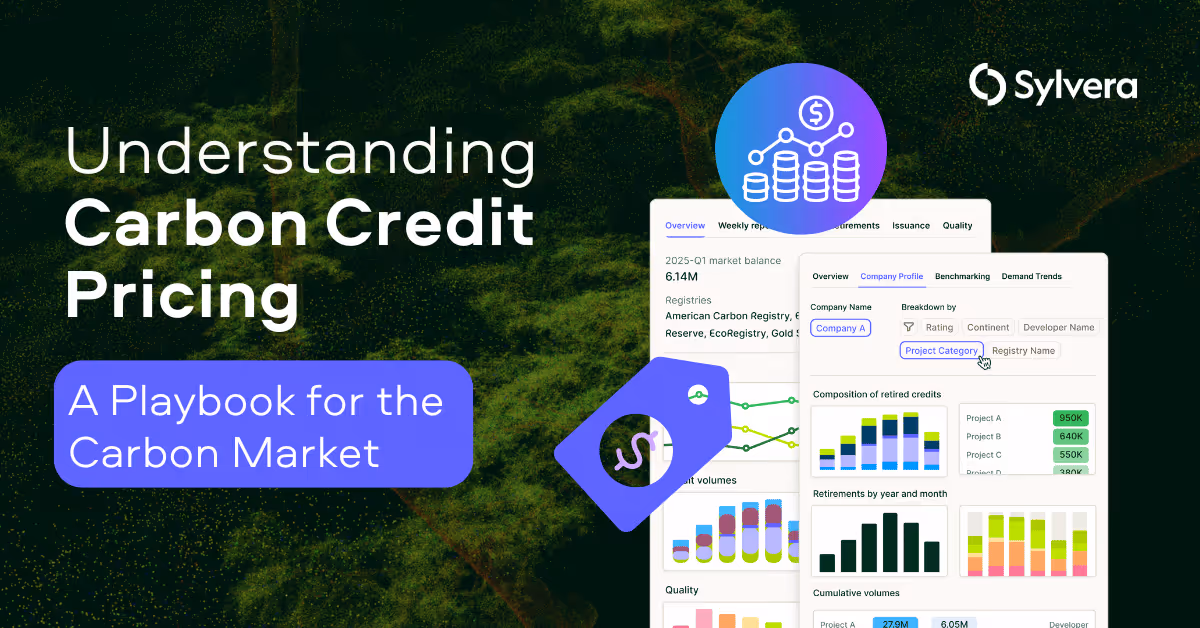
Sylvera Market Intelligence aborda esta cuestión unificando los precios, la actividad real de los compradores, las señales de integridad y el contexto político en un único espacio de trabajo diseñado para la toma de decisiones procesables.
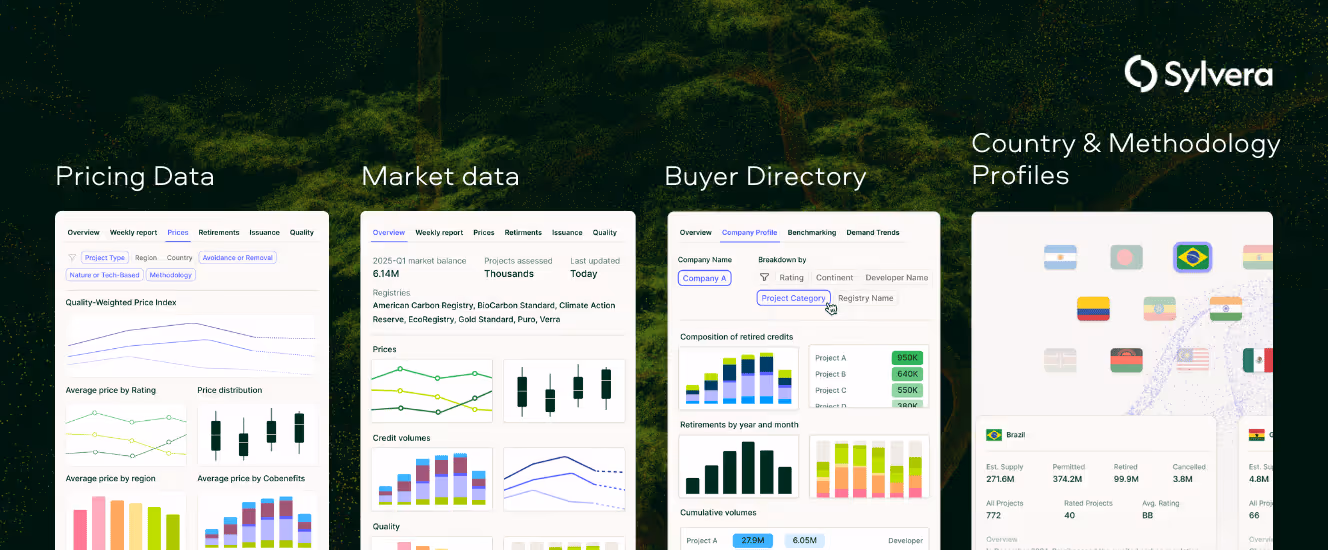
Pricing Data ofrece estimaciones de precios al contado a nivel de proyecto para miles de proyectos de carbono, con el apoyo de ocho índices de precios que realizan un seguimiento de los precios ajustados a la calidad para tipos de proyectos específicos. En lugar de basarse en informes de mercado anticuados o en información anecdótica sobre precios, los usuarios acceden a referencias de mercado actuales.
Market Data ofrece informes semanales sobre las emisiones y retiradas de registros, que pueden filtrarse por tipo de proyecto, calificación, antigüedad, región, metodología y elegibilidad de conformidad. Esta información permite a los usuarios detectar señales tempranas y tomar decisiones de compra en función de la dinámica del mercado.
Buyer Directory transforma las especulaciones sobre la demanda en movimientos visibles del mercado. Los usuarios pueden analizar quién está comprando qué créditos por sector, geografía, antigüedad y tipo de proyecto, pasando de las anécdotas a una comprensión de la demanda del mercado basada en datos.
Los perfiles de países y metodologías ayudan a trazar las vías de CORSIA y del artículo 6, al tiempo que rastrean la aceptación de la metodología y los riesgos conocidos. Esta integración garantiza que las decisiones de contratación tengan en cuenta la elegibilidad política sin necesidad de realizar investigaciones separadas en múltiples marcos normativos.
Las proyecciones de precios amplían este análisis a escenarios prospectivos con curvas de precios bajos, medios y altos hasta 2050 por tipo de proyecto, lo que permite una planificación estratégica más allá de las condiciones actuales del mercado.
¿Qué significa esto para las empresas compradoras y los inversores?
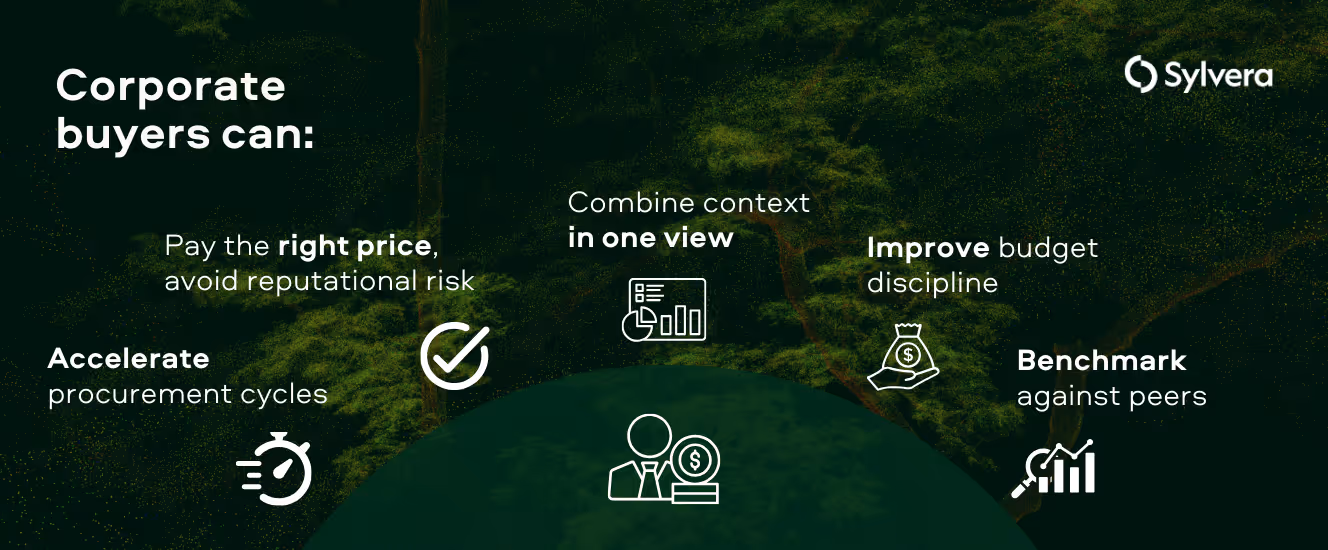
Los compradores de las empresas evitan las malas compras, pagan los precios correctos y reducen los ciclos de aprovisionamiento.
Pague el precio correcto y evite el riesgo para su reputación: acceda a referencias verificadas en lugar de basarse en capturas de pantalla y rumores para tomar decisiones que puedan justificar la junta directiva.
Acelere los ciclos de adquisición: proporcione a los equipos de adquisición, jurídicos, financieros y de comunicación conjuntos de datos compartidos y fiables que reduzcan la repetición del trabajo y aceleren la toma de decisiones.
Combinar el contexto en una sola vista - Combinar la elegibilidad, la integridad y el contexto de precios para evitar el suministro de políticas en riesgo, garantizando al mismo tiempo que los créditos cumplen las normas de calidad.
Mejore la disciplina presupuestaria: obtenga una visibilidad de precios y suministros que respalde la planificación anual y el seguimiento de las desviaciones.
Comparación con sus homólogos: utilice la funcionalidad del Directorio de Compradores para defender las decisiones estratégicas ante los directivos mediante comparaciones basadas en pruebas.
Ejemplo de estudio de caso de comprador:
El Director de Sostenibilidad de una empresa tecnológica se prepara para su ciclo anual de adquisiciones con un presupuesto de créditos de carbono de 2 millones de dólares. Cada semana, utiliza Market Intelligence para seguir los movimientos de precios en sus categorías de proyectos objetivo, principalmente proyectos de ARR de alta calidad y biocarbón.
Cuando un proveedor potencial se acerca con créditos ARR a 28 dólares por tonelada, utilizan Inteligencia de Mercado para compararlo con proyectos comparables de similar antigüedad y geografía, descubriendo que el precio de mercado se acerca más a 24 dólares por tonelada. Armados con estos datos, negocian un precio justo que ahorra a la empresa 40.000 dólares, manteniendo al mismo tiempo los niveles de calidad.
Durante las presentaciones trimestrales al consejo de administración, utilizan el Directorio de Compradores para mostrar cómo su estrategia de compras se alinea con la de otras empresas de su sector, demostrando que su enfoque en proyectos de alta calificación coincide con los planteamientos de los líderes del sector. Cuando el director financiero cuestiona la prima pagada por los créditos con calificación AAA, presentan datos que demuestran que estos créditos conllevan primas constantes de 5 dólares por banda de calificación, lo que justifica que la inversión se ajusta al mercado y es adecuada al riesgo para la reputación de su marca.
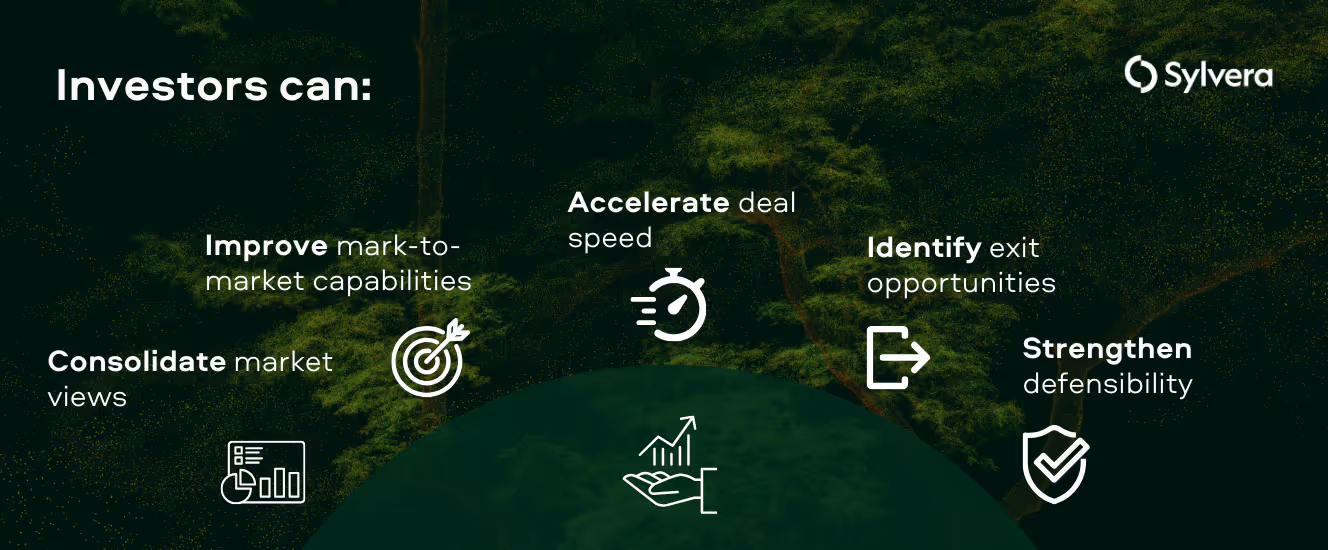
Inversores y operadores se despliegan con mayor rapidez y precisión, con señales ajustadas a la integridad
Visión consolidada del mercado: acceso a datos integrados sobre calidad, política, precios y actividad del mercado para la movilización de capital basada en datos.
Capacidad de valoración a precios de mercado: ayuda a calcular el valor liquidativo y a presentar el CI con señales de precios verificadas y comparables ajustados a la integridad para tomar decisiones de inversión ajustadas al riesgo.
Acelerar la velocidad de las negociaciones: acceda a la oferta, los precios y el contexto político en una sola plataforma, en lugar de coordinar múltiples fuentes de datos.
Identificar oportunidades de salida - Aprovechar los conocimientos sobre el comportamiento de los compradores para detectar oportunidades de demanda de salida y optimizar el calendario de la cartera en función de la dinámica del mercado.
Reforzar la defensibilidad interna - Utilizar datos independientes para respaldar los memorandos del CI, las actualizaciones de los LP y las presentaciones del comité de riesgos con validación de terceros en lugar de estimaciones generadas internamente.
Ejemplo de estudio de caso de un inversor:
Al evaluar una inversión de 3 millones de dólares en un nuevo proyecto de biocarbón, un gestor de cartera de un fondo de inversión utiliza la Inteligencia de Mercado para comparar el precio propuesto de 190 dólares por tonelada con proyectos de biocarbón comparables, descubriendo que proyectos similares cotizan entre 170 y 220 dólares por tonelada dependiendo de la permanencia. El Directorio de Compradores revela crecientes retiradas de empresas tecnológicas en su mercado objetivo, apoyando los planes de inversión.
Durante las llamadas mensuales a los LP, presentan el rendimiento de la cartera utilizando precios de referencia, mostrando que sus inversiones han superado las medias del mercado en un 12% gracias a una selección inteligente de proyectos. Cuando un coinversor cuestiona su exposición a los créditos CORSIA, demuestran mediante un análisis de escenarios que la aplicación de la política podría generar una revalorización de los precios del 50-75%, lo que justifica la posición tanto por aversión al riesgo como por oportunismo.
Antes de ejecutar un reequilibrio importante de la cartera, analizan los patrones de retirada de los compradores en diferentes sectores empresariales, identificando una mayor demanda de créditos de biocarbón por parte de las empresas de servicios financieros. Esta inteligencia les ayuda a programar la venta de posiciones de biocarbón para captar primas, generando un rendimiento adicional del 15% en comparación con las medias del mercado.
Introducción a la inteligencia de mercado
Las plataformas de inteligencia integradas se están convirtiendo en una infraestructura esencial en todos los mercados financieros. Las organizaciones que adoptan la inteligencia integral del mercado del carbono se posicionan ahora para navegar por la creciente complejidad mientras capitalizan las oportunidades emergentes.
La Inteligencia de Mercado deSylvera ayuda a compradores e inversores a evitar datos fragmentados con una visión unificada que permite tomar decisiones con confianza en un mercado complejo.
¿Está listo para ver cómo la Inteligencia de Mercado puede transformar su estrategia de adquisición de carbono? Programe una demostración para explorar la inteligencia unificada de precios, demanda y calidad en acción.
Obtenga los últimos datos y análisis sobre los precios de los créditos de carbono.
Para conocer los datos más recientes sobre los precios, la calidad y las tendencias de la demanda de los créditos de carbono, consulte nuestro completo informe sobre el estado de los créditos de carbono.