




“Over the years we’ve invested significantly in our field data team - focusing on producing trusted ratings. While this ensures the accuracy of our Ratings, it doesn’t allow the scale across the thousands of projects that buyers are considering.”

For more information on carbon credit procurement trends, read our "Key Takeaways for 2025" article. We share five, data-backed tips to improve your procurement strategy.

One more thing: Connect to Supply customers also get access to the rest of Sylvera's tools. That means you can easily see project ratings and evaluate an individual project's strengths, procure quality carbon credits, and even monitor project activity (particularly if you’ve invested at the pre-issuance stage.)
Book a free demo of Sylvera to see our platform's procurement and reporting features in action.
Headline numbers
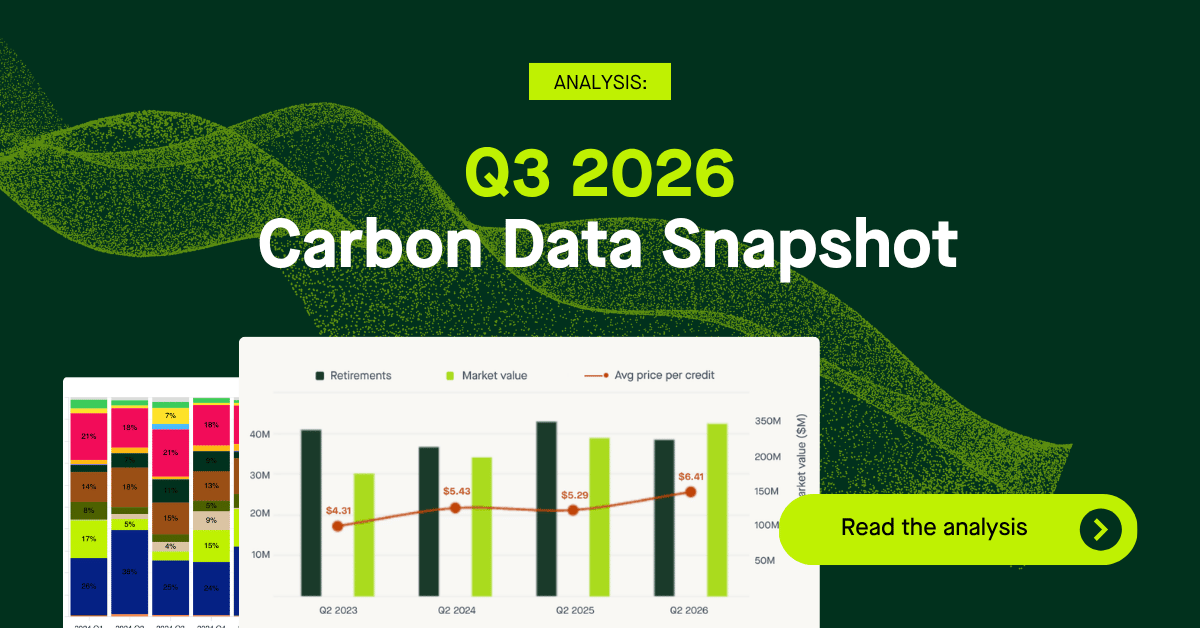
Carbon credit retirements reached 30.6 million in Q3 2026, down 9% from 33.7 million in the same period last year. Across the year to date, retirements totalled 130.3 million, marginally above the 129.1 million recorded in the first three quarters of 2025.
Total market value for retired credits for Q3 2026 grew to $211.8 million, up from $190.6 million a year earlier, and YTD 2026 value reached $798 million, up 14% from $697.3 million over the same period of 2025.
This continues the trend of value growth across the market. The average price paid per credit retired rose to $6.92 in Q3 2026, up from $5.66 in Q3 2025 - and for 2026 YTD, average price reached $6.12, up from $5.40 a year earlier.
[Graph: Q3 YoY volumes, value, share]
Quality and price
Investment-grade (≥BBB) credits continue to command a high share of market value. In Q3 2026, ≥BBB credits made up 18% of rated retirement volume but 42% of rated market value.
The size of that premium varies by project type. BBB+ ARR credits averaged $23.47 in Q3 2026 vs $12.80 for ≤BB ARR, a premium of 1.83x, consistent with the roughly 2x premium seen in every quarter since Q1 2025.
In IFM, the premium keeps widening as the top end rises. The gap between BBB+ and ≤BB IFM prices has grown steadily from $5.76 in Q3 2025 to $8.28 in Q3 2026. BBB+ IFM prices have climbed from $18.73 to $21.07 in that period, while ≤BB IFM prices have been roughly flat ($12.97 → $12.79).
BBB+ REDD+ prices have risen 58% from $4.90 (Q3 2025) to $7.75 (Q3 2026), while ≤BB REDD+ rose too, from $2.70 to $3.56. The quality spread widened from $2.20 in Q3 2025 to $4.19 in Q3 2026, nearly double.
Major retirees
The most active retirees of the quarter were Japanese transport and logistics company Yamato Transport Co. and fintech Corpay (formerly Fleetcor), both retiring 2 million credits in Q3 2026.
Eni is the leading retiree of 2026, having retired 9 million credits this year. Shell remains a notable absentee from the leading retirees of 2026, having retired just 496k credits YTD, compared to 7 million in the first three quarters of 2025 - continuing the pullback first flagged in our Q2 2026 edition.
Project types: retirements
Renewables held the largest market share in Q3, accounting for 41% of retirements. But this is not a growth story. Its higher share largely reflects the rest of the market dipping in Q3, with REDD+ for example pulling back from its Q2 spike, rather than a surge in renewables buying.
Over the longer term, renewables retirements have been in decline. Full-year volume peaked at 99.7M in 2022 and fell every year after, to 49.3M in 2025. Q1-Q3 2026 volume of 40.7M is flat from the same period in 2025, and about half the 2022 level (77.1M). As the quality section below shows, because it still makes up such a large share of the market, it carries consequences for the retirement market's overall rating profile.
REDD+ fell back to 18% of retirements, down from a Q2 spike of 38%. The Q2 number was driven mainly by a single major retirement. That aside, REDD+ is fairly stable, with a broadening contributor base including Colombia, Brazil, Cambodia, Peru and new entrant DR Congo.
Agriculture was another retirements growth area, more than tripling its share (2.55% → 7.82%) and more than doubling volume.
[GRAPH: Project type retirements]
Quality of retirements
The renewables category carries no Sylvera rating above C, (generally grid-connected renewable projects are marked as having weak additionality). Because of that structural ceiling, renewables accounted for 76% of all B/C/D-rated retirement volume this quarter.
The knock-on effect is visible market-wide: the B/C/D share of all retirements hit 66.1% in Q3 2026, its highest share since Q3 2023, and renewables alone accounts for roughly three-quarters of that low-rated volume.
Retirements by buyer sector
When looking by sector, in Q3 2026, buyers from the transportation and logistics sector leaned on renewables, which made up 62.5% of their retirements. Financials and professional services split between renewables (34.4% and 35.8%) and REDD+ (34.0% and 33.9%).
Energy and utilities buyers accounted for roughly half of all agriculture retirements, and agriculture rose from 6.8% of their mix in Q3 2025 to 28.0% in Q3 2026. These buyers moved away from REDD+, which fell from 54.2% of their mix in Q3 2025 to 28.6% in Q3 2026.
IT buyers concentrated on fugitive and industrial gases, which made up 64.3% of their Q3 2026 retirements. Healthcare and consumer goods buyers favoured REDD+ and IFM.
Project types: Issuances
Renewables issuance jumped to 27.2% share in Q3 2026 (from 14.5% in Q2), its highest issuance share since Q1 2025, and highest issuance volume since Q2 2024 - mirroring the retirement-side story above.
REDD+ issuance rebounded sharply to 19.2% share (17.3M), while cookstoves held a stable 21.6% share.
These gains came largely at the expense of Fugitive & Industrial Gases, which fell from 32.6% share in Q2 to just 11.1% in Q3, with IFM also decreasing (12.3% → 2.7%).
[Project type issuances]
Quality of issuances
Headline investment-grade (≥BBB) issuance jumped to 53% of rated issuance volume in Q3 2026, due to a significant single project, as the Katingan Peatland Restoration project in Indonesia issued 10.78M AA-rated credits this quarter, accounting for over 97% of all AA-rated issuance and pushing AA's share from 3.6% to 40%.
A broader signal is the year-to-date comparison: ≥BBB issuance share rose from 28% (2025) to 43% (2026) across the first three quarters, corroborated by D-rated share nearly collapsing (25% → 5%) over the same period. C-rated issuance did see a rise to 33% in Q3, due to a cluster of large Indian renewables projects.
Methodologies
Across both retirements and issuances, the top methodology tables reinforce the project-type stories covered above. ACM0002 - the CDM methodology for grid-connected renewable electricity - is the largest contributor to both retirements and issuances, reflecting renewables' Q3 share on both sides of the market.
REDD+ methodologies (VM0007, VM0009, ART-TREES) also feature prominently reflecting the project type's quarter-on-quarter issuance rebound and its underlying retirement stability.
Forward offtake market continues to diversify
When looking at the offtake market, the decline from 2025 to 2026 remains stark, fundamentally explained by Microsoft's pullback, as covered in our Q2 2026 edition. Amongst disclosed offtakes, total offtake volumes announced fell 53% year-on-year to 32.7 million tonnes in YTD 2026 (from 70 million), and total value dropped 65% to $3.48 billion (from $9.96 billion).
In Q1-Q3 2025, Microsoft accounted for 62M of the market's 70M announced offtakes - 89% of total volume. In Q1-Q3 2026, Microsoft's announced offtake volume is 9.5M - still the leading offtaker, and making up almost a third of the 32.7M total market volume - but down 85% from this point in 2025.
However, putting Microsoft aside, the rest of the market continues to grow. Non-Microsoft offtake volume almost trebled year-on-year, from 8 million tonnes in Q1-Q3 2025 to 23 million tonnes in the same period of 2026.
[Value of offtakes vs volume of offtakes]
This sees the offtake market continuing to diversify: Woodside has emerged as the second-largest offtaker so far in 2026 at 6.6M tonnes, and Alphabet (Google) has moved to third at 3.46M, following Q3 announcements of major enhanced weathering and rice-emission-reduction offtakes with Terradot and Mitti Labs.
In terms of offtake project types, ARR has the largest share of volume with 40% (13.2M) of all offtakes announced in 2026. Regenerative agriculture has moved to second in volume, at 7.3M, and biochar third at 4.9M. Biochar leads in terms of offtake value, at $1.25B of the $3.48B total offtake market value.
Want to explore these market dynamics yourself?
Our Market Intelligence suite provides transparency across the market with real-time pricing, supply and demand data.
💲 Pricing Data – Project-level spot estimates, with 20,000+ estimates powered by ~300,000 transactions.
📈 Market Data – Weekly issuances and retirements, filterable average prices, and known supply integration.
🏢 Buyer Directory – See who’s retiring what by sector, type, vintage, and geography to validate demand.
Find out more about Market Intelligence here, or request your free demo now.



.png)
