“Over the years we’ve invested significantly in our field data team - focusing on producing trusted ratings. While this ensures the accuracy of our Ratings, it doesn’t allow the scale across the thousands of projects that buyers are considering.”

For more information on carbon credit procurement trends, read our "Key Takeaways for 2025" article. We share five, data-backed tips to improve your procurement strategy.
One more thing: Connect to Supply customers also get access to the rest of Sylvera's tools. That means you can easily see project ratings and evaluate an individual project's strengths, procure quality carbon credits, and even monitor project activity (particularly if you’ve invested at the pre-issuance stage.)
Book a free demo of Sylvera to see our platform's procurement and reporting features in action.
Cement has long been treated as an undifferentiated commodity. A tonne of cement is a tonne of cement. But our recent analysis, covering more than 3,000 facilities across 163 countries, reveals a reality that has significant implications for how producers compete, attract investment, and monetise their lower-carbon performance.
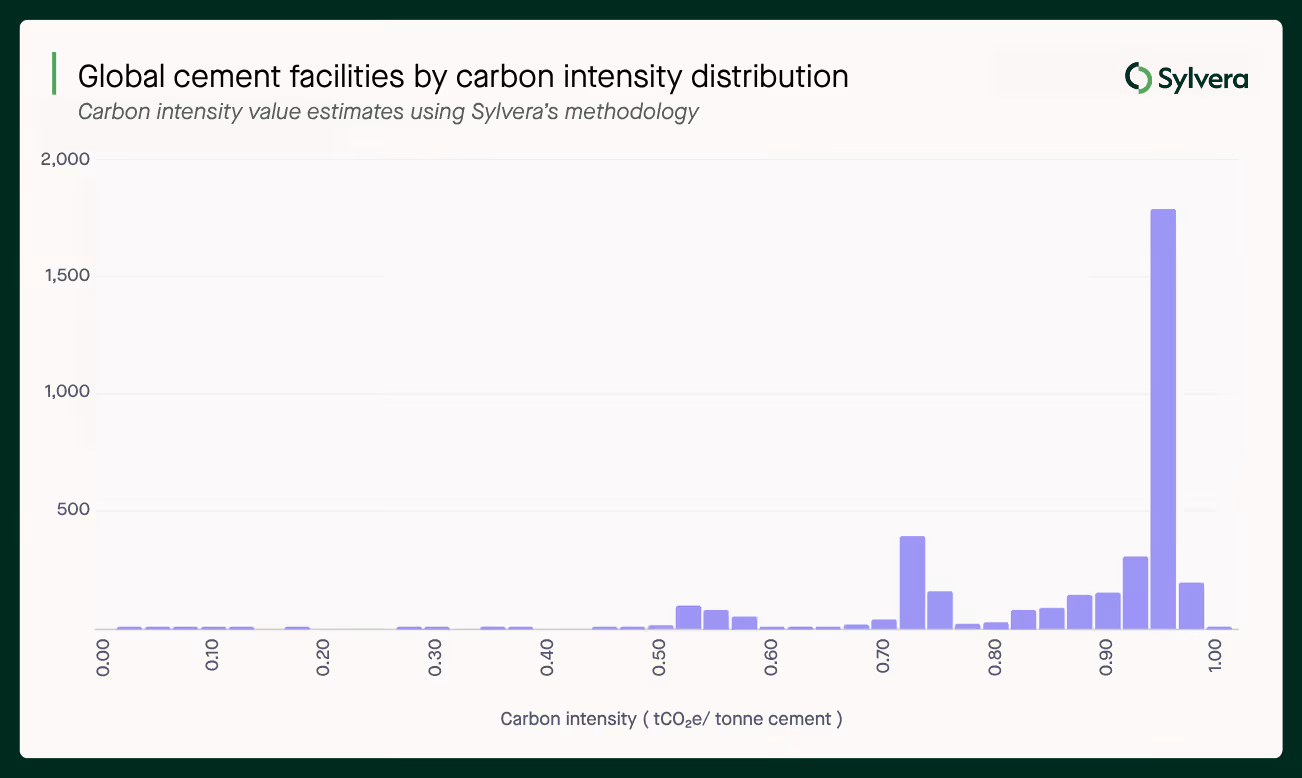
The data: a fortyfold spread in carbon intensity
Our analysis of global cement production, using our proprietary like-for-like framework applied consistently across facilities, finds carbon intensities ranging from 0.03 to 1.24 tCO₂e per tonne of cement. That’s a fortyfold difference between the lowest and highest emitters.
This reflects structural differences in production methods, raw materials, fuel choices, and the presence or absence of emissions abatement technology.
The spread matters because:
- Carbon pricing schemes, including the EU Emissions Trading System (ETS), price every kilogram of CO₂e. A facility at 0.16 tCO₂e/t faces a fundamentally different cost structure than one at 0.95 tCO₂e/t under the same regime.
- Buyers with Scope 3 reduction commitments are beginning to differentiate between suppliers based on carbon performance — not just price and quality.
- Investors assessing long-term asset viability increasingly need to understand where a facility sits on the carbon intensity curve, not just whether it clears an arbitrary threshold.
What drives the difference?
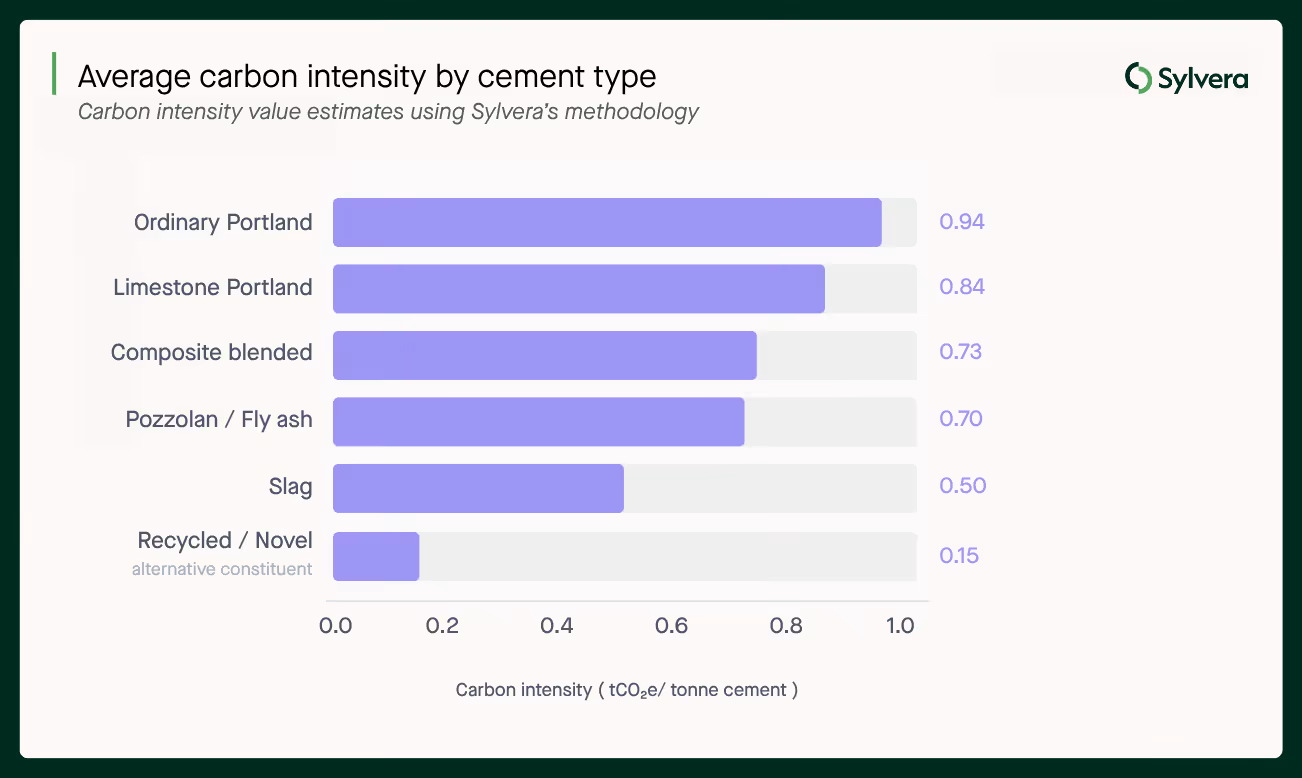
The lowest-carbon facilities in Sylvera's dataset are predominantly those using alternative cement types and production methods:
- Slag blends and fly ash cements replace a significant proportion of clinker — the most carbon-intensive element of cement production — with industrial by-products.
- Recycled and novel materials reduce the need for energy-intensive raw material processing.
- Alternative fuel use reduces the emissions intensity of the production process itself. Approximately 21% of all facilities analysed make use of alternative fuels to some degree.
- Carbon capture and storage (CCS) remains rare — present at around 1% of facilities — but represents the most significant individual abatement lever available at the facility level.
Traditional Portland cement, by contrast, sits towards the higher end of the carbon intensity range at around 0.95 tCO₂e/t. It remains the dominant production method globally, but the competitive pressure it faces from lower-carbon alternatives is growing.
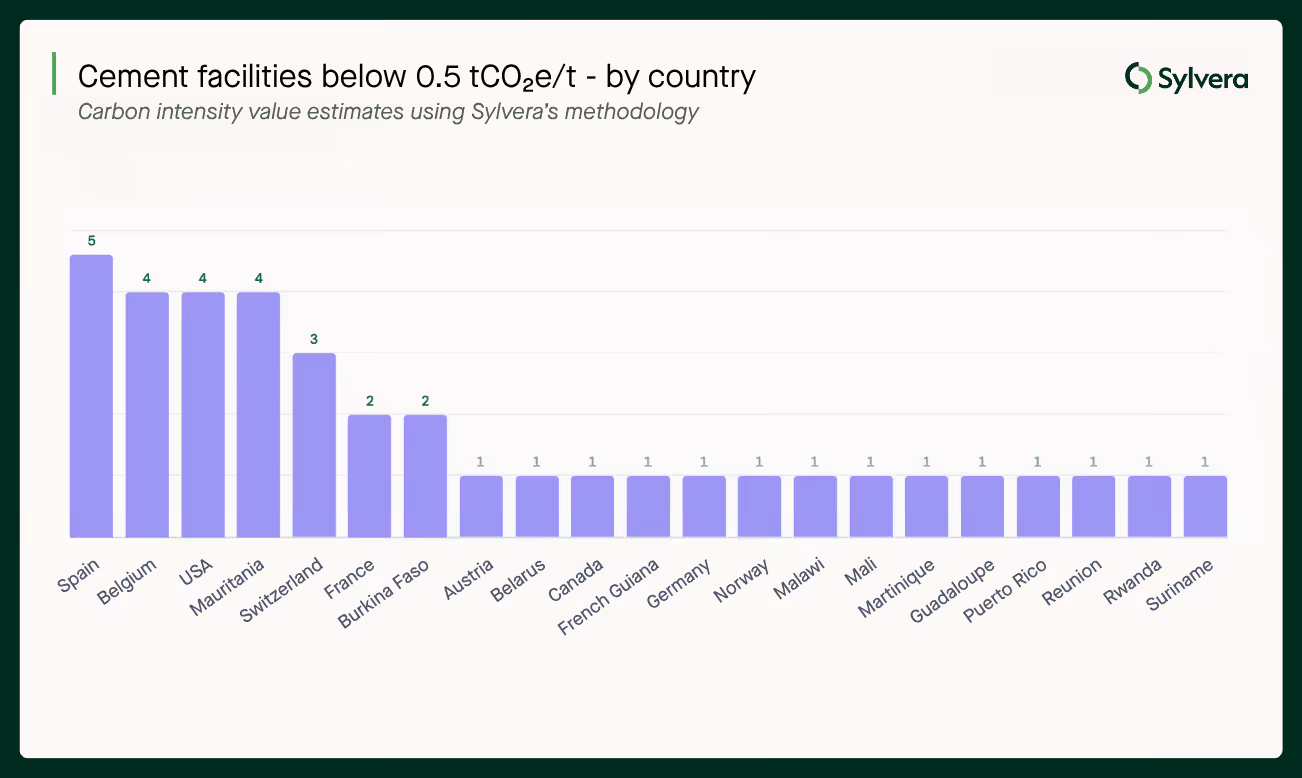
Europe leads in lower-carbon intensity cement production
The global distribution of low-carbon cement production is heavily skewed toward Europe. The vast majority of facilities capable of producing cement below 0.5 tCO₂e/t are concentrated there, with Spain (5 facilities) and Belgium (4 facilities) leading by count. Significantly, all of these facilities are operated by Heidelberg or Holcim — two of the sector's largest incumbents.
This concentration has several implications for producers:
- Where compliance schemes are most developed, low-carbon production is most advanced. The EU ETS and CBAM are not just cost pressures — they are reshaping where investment in low-carbon production is going. Producers in or adjacent to these regulatory environments face the most acute near-term pressure, but also the most immediate commercial opportunity.
- Scale and incumbency create advantages. The fact that low-carbon leadership is concentrated in the hands of large, established players reflects the capital intensity of the transition. Smaller producers face steeper hurdles — but also a more open market for differentiated positioning if they can demonstrate performance credibly.
- Emerging markets present a different picture. The presence of low-carbon facilities in markets such as Mauritania, Burkina Faso, and Rwanda — often driven by specific material inputs or production methods rather than regulatory pressure — suggests that carbon intensity leadership is not solely a function of geography or compliance exposure.
The regulatory environment: from cost pressure to competitive reshaping
The policy backdrop is shifting in ways that will affect how cement producers compete over the coming decade.
EU ETS and CBAM are progressively removing the protection previously afforded by free allowances, exposing cement producers to the real cost of carbon and levelling the playing field between domestic and imported materials. Facilities with higher carbon intensity face growing structural cost pressure as these mechanisms tighten.
Public procurement requirements are beginning to create explicit demand signals for lower-carbon materials. The EU's Industrial Accelerator Act is currently in proposal and is looking to ensure that 5% of cement used in public tenders be low-carbon. Ireland has introduced rules requiring public projects to replace at least 30% of clinker with low-carbon alternatives.
Corporate procurement is following the same direction. Large organisations with net-zero commitments and Scope 3 targets are introducing carbon intensity thresholds into supplier requirements. For producers, this means that carbon performance is increasingly a qualification criterion, not just a reputational consideration.
The monetisation question: what can lower-carbon performance actually deliver?
For producers who have invested in lower-carbon production, or who are considering it, the critical question is how to capture the commercial value of that performance. Multiple routes exist, and understanding which applies to your facility and commodity is increasingly a strategic priority.
- Direct price comparison. Buyers willing to pay above commodity price for lower-carbon materials are a growing, if still nascent, segment. The ability to demonstrate performance credibly — with standardised, third-party validated data — is a prerequisite for these conversations.
- Environmental Attribute Certificates (EACs) and Book & Claim. EACs allow the carbon intensity attributes of a product to be separated from the physical commodity and sold independently. This creates a route to monetisation that does not require the buyer to take physical delivery of the lower-carbon material, expanding the potential buyer pool significantly.
- EU ETS and CBAM compliance value. For producers operating within or selling into EU markets, lower carbon intensity directly reduces compliance costs, and, as free allowances are phased out, this benefit compounds.
- Carbon credits. In some cases, lower-carbon cement production relative to a credible baseline may support the generation of carbon credits under voluntary or Article 6 frameworks, though applicability depends on methodology, additionality, and specific regulatory context.
The challenge for most producers is navigating these routes simultaneously. Understanding eligibility, comparative value, and the data requirements for each is complex.
Why data is the foundation
Across all of these mechanisms, one requirement is consistent: credible, standardised, facility-level carbon intensity data.
Without it, producers cannot demonstrate performance to buyers. Buyers cannot make informed procurement decisions. Investors cannot assess long-term asset competitiveness. And the market for carbon-differentiated cement cannot develop the liquidity and trust it needs to function at scale.
The fortyfold gap in carbon intensity is both a challenge and an opportunity. It means the market is currently operating with significant information asymmetry. Lower-carbon leaders are not reliably capturing value for their performance, and buyers do not have the visibility to direct procurement toward the best assets. Transparent, granular data is the mechanism through which that changes.
How Sylvera supports cement producers
Sylvera's platform is designed to help producers understand, demonstrate, and monetise their carbon intensity performance:
- Facility-level carbon intensity assessments using a standardised, transparent methodology, providing the credible data needed for buyer conversations, investor due diligence, and mechanism applications
- Mechanism mapping, identifying which compliance regimes, certification schemes, procurement standards, and market mechanisms your facility and production methods qualify for, and modelling the comparative value of each
- Commodity Insights on supply, demand, offtake dynamics, and pricing trends across carbon-differentiated cement and broader construction materials markets. Try for free now.
- Strategic decision support to help producers evaluate investment decisions and go-to-market strategy based on mechanism eligibility and carbon performance