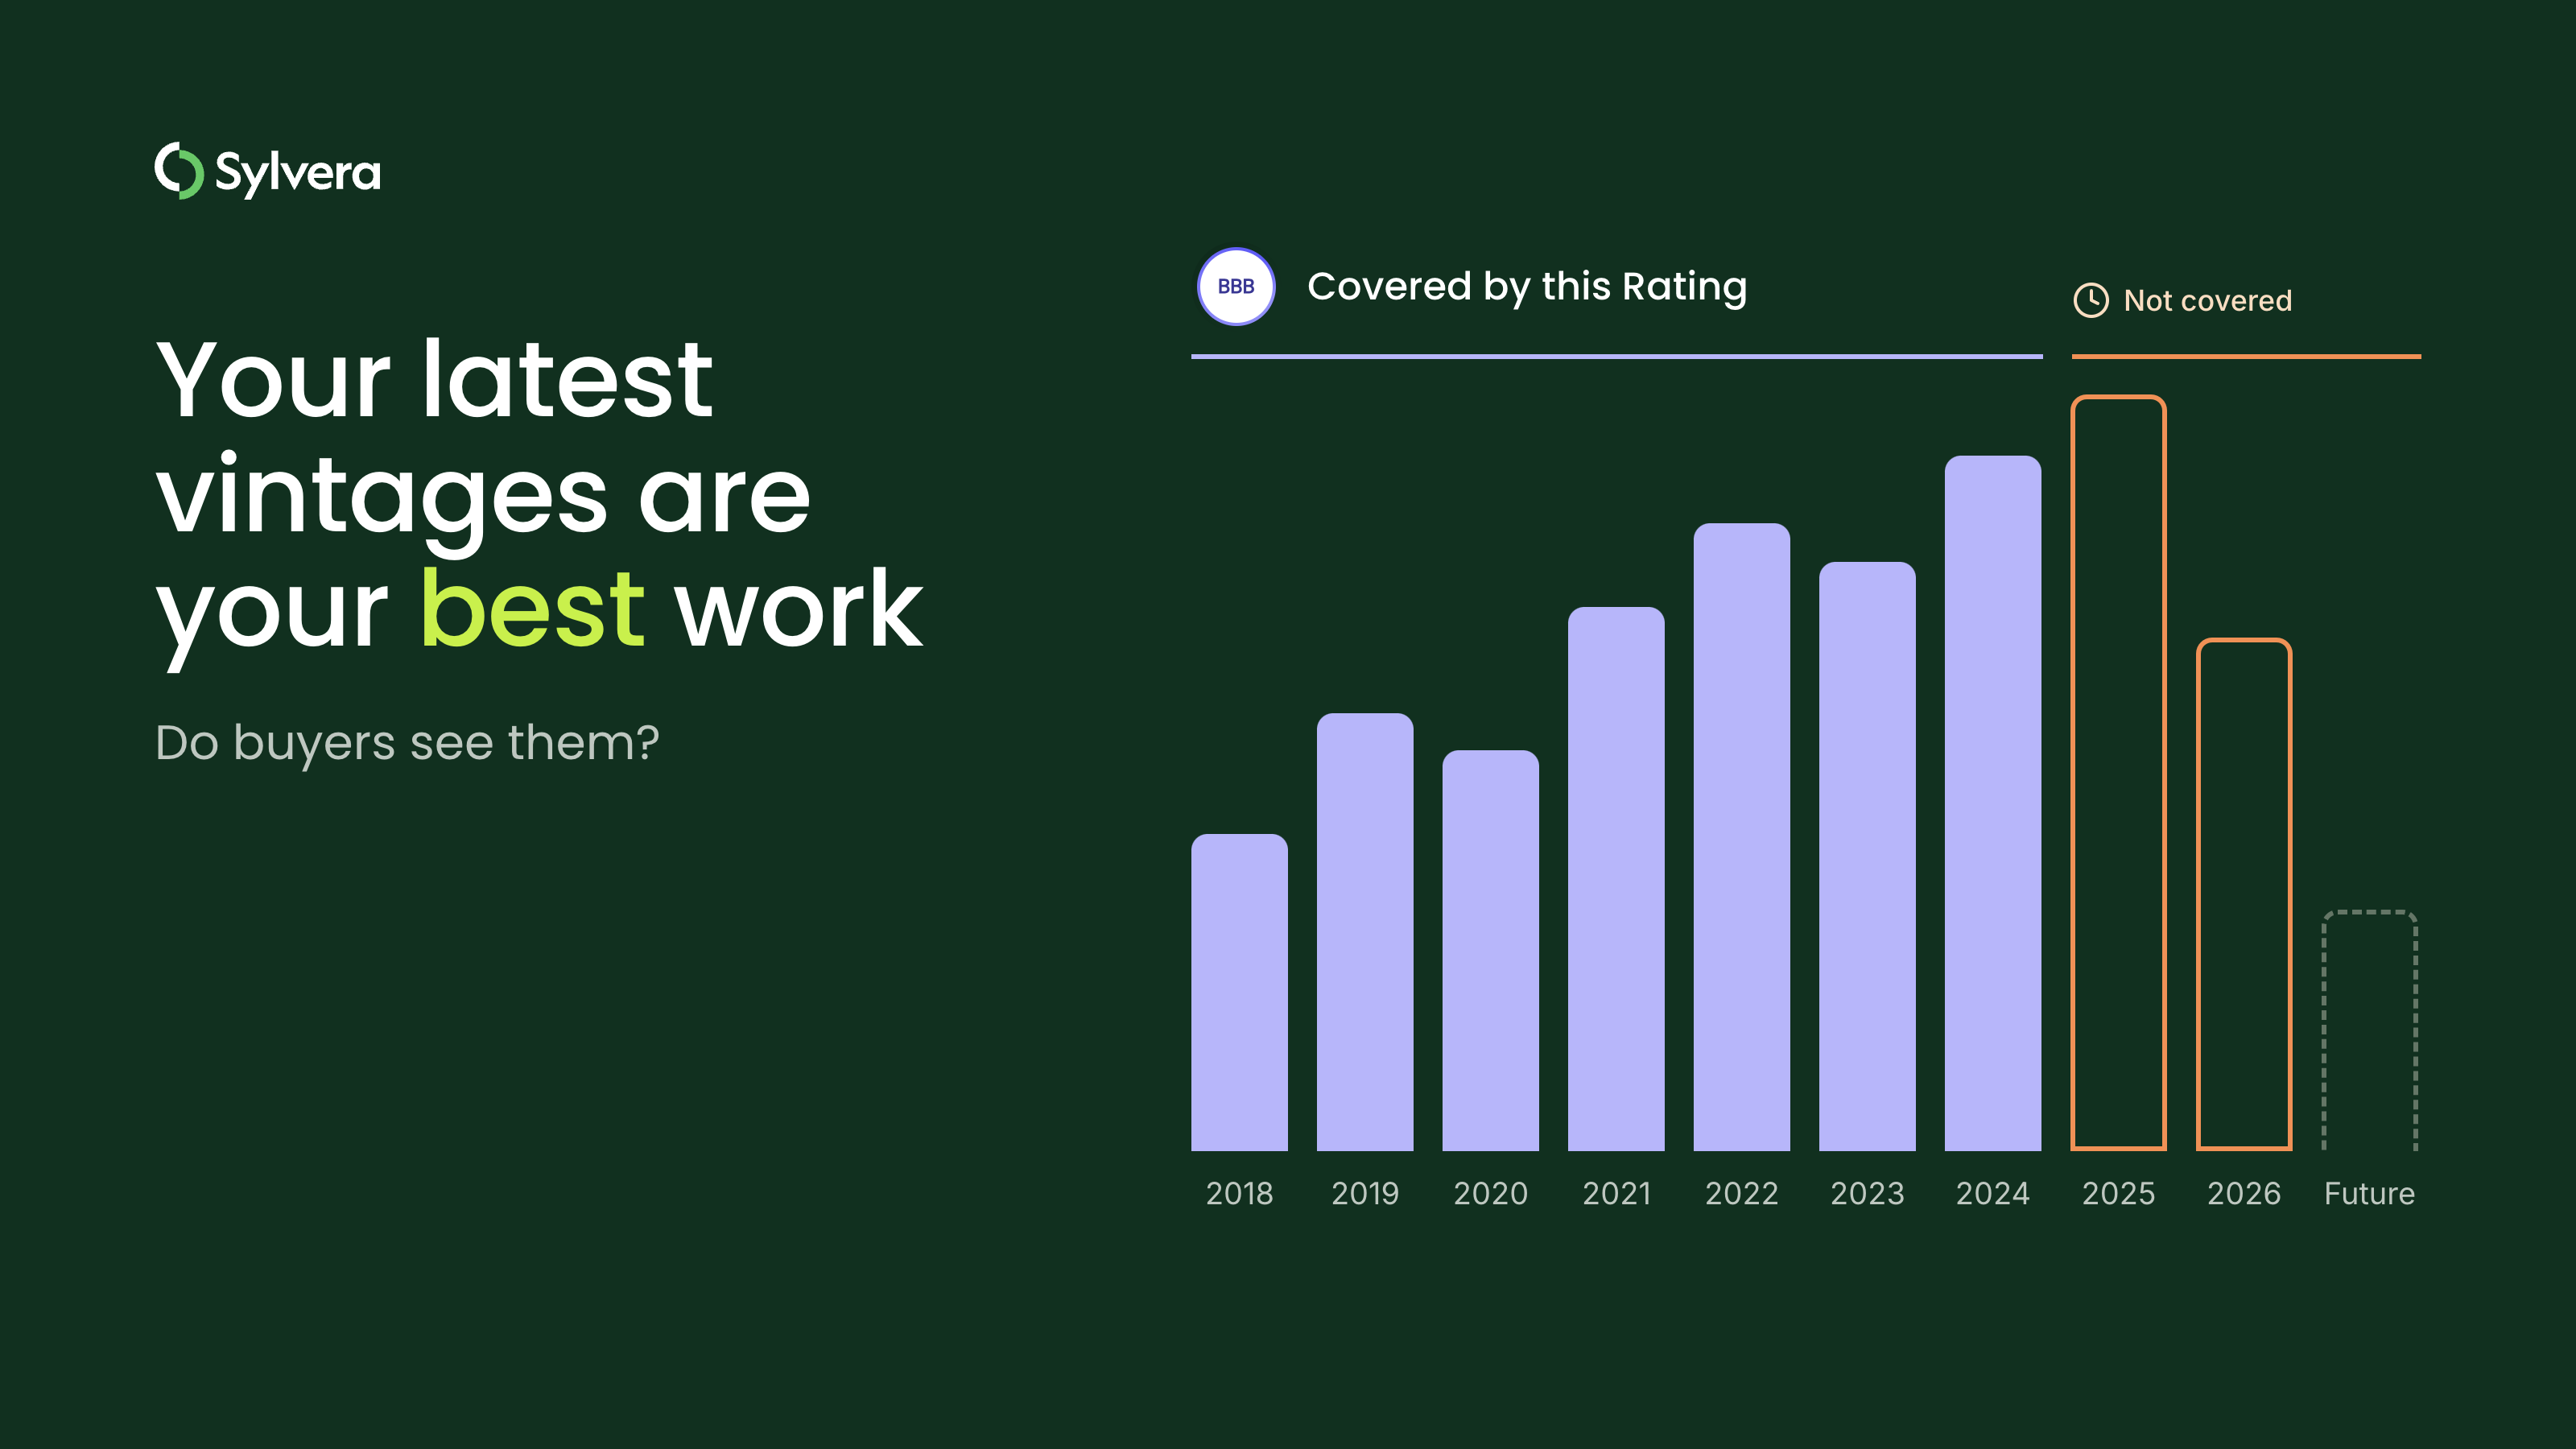
“Over the years we’ve invested significantly in our field data team - focusing on producing trusted ratings. While this ensures the accuracy of our Ratings, it doesn’t allow the scale across the thousands of projects that buyers are considering.”

For more information on carbon credit procurement trends, read our "Key Takeaways for 2025" article. We share five, data-backed tips to improve your procurement strategy.
One more thing: Connect to Supply customers also get access to the rest of Sylvera's tools. That means you can easily see project ratings and evaluate an individual project's strengths, procure quality carbon credits, and even monitor project activity (particularly if you’ve invested at the pre-issuance stage.)
Book a free demo of Sylvera to see our platform's procurement and reporting features in action.
The voluntary carbon market has grown rapidly in both scale and ambition, yet one of its most fundamental questions lacks transparency: what does it actually cost to deliver a high-integrity carbon credit?
Without reliable cost data, buyers cannot determine whether a quoted price reflects genuine delivery costs or a quality shortfall. Developers cannot benchmark against sector norms, policymakers lack the empirical grounding to design evidence-based price floors, and project-hosting communities cannot assess whether benefit-sharing terms represent a fair share of project economics.
Sylvera partnered with the Integrity Council for the Voluntary Carbon Market (ICVCM) to help provide the answer. Our new report, Understanding the True Cost of a High-Quality Carbon Project, draws on cost data from 53 carbon projects across multiple project types.
Download the report here: Understanding the True Cost of a High-Quality Carbon Project.

How much does it cost to create a carbon credit?
The median levelized cost per credit ranges from $6 for REDD+ to $185 for biochar. The report finds a significant divergence across project types, highlighting the premium associated with more engineered or intensive removal methodologies.
Costs also vary within each type. Individual biochar projects ranged from about $25 to $544 per credit, and REDD+ projects from $1 to $15. Due to limited sample sizes, mangroves and regenerative agriculture were not analyzed further.
What goes into the cost of a carbon credit?
A carbon credit's cost has two parts: capital expenditure (CapEx) and operating expenditure (OpEx).
- CapEx covers upfront investment costs incurred prior to or during the early stages of a carbon project, including land acquisition, site preparation, validation, and first verification.
- OpEx covers the ongoing annual costs of running a carbon project after initial establishment, including monitoring, verification, community engagement, and project management.
According to the report, the cost of producing a high-integrity credit varies by capital intensity, the lag between investment and issuance, access to affordable financing, and the rigor of social and environmental standards applied.
How does cost of capital affect the cost of a carbon credit?
The report finds that the cost of capital stands out as one of the single greatest sources of uncertainty in carbon project economics, particularly for nature-based solutions. It tested how the median levelized cost per credit changes when the assumed cost of capital moves from the moderate scenario (10%) to low (5%) or high (15%) scenarios.
ARR's higher CapEx share and longer payback horizon mean that changes in the discount rate have a larger effect on the annualized capital component, and therefore on the total levelized cost. This dynamic is most acute for nature-based solutions operating in emerging markets and developing economies, where sovereign risk, currency risk, and political instability can be substantial. Smaller developers, community-led and Indigenous-led projects, and those operating in frontier geographies often face the steepest financing cost penalties, yet can find it hardest to access the instruments designed to address them.
Do larger carbon projects produce cheaper credits?
The data points that way. All four project types analyzed display a negative relationship between cost per credit and scale: higher-volume projects tend to have lower unit costs. However, the sample cannot separate true scale economies from project heterogeneity, so all relationships should be treated as directional rather than statistically robust.
For biochar, both the upfront pyrolysis equipment and the ongoing feedstock and logistics costs include components that become more efficient at higher throughput. For ARR, land acquisition and planting are significant contributors to upfront cost, though geography also plays an important role. For cookstoves, the relationship likely reflects bulk procurement discounts, paired with improvements in distribution and logistics efficiency at scale.
How do secondary revenues affect a carbon project's additionality?
Secondary revenues are non-carbon income, such as timber and non-timber forest products from ARR projects, or biochar sold as a soil amendment or fertilizer substitute. Non-carbon income ranges from 0% to 50% of total revenue for ARR projects, and 0% to 75% for biochar. Most biochar projects in the survey rely on secondary revenues at varying levels.
Projects with predictable non-carbon income streams may be better positioned to secure project finance, though the report notes this connection is not yet well evidenced in the published literature. Secondary revenues also bear directly on financial additionality. Under most crediting standards, a project is considered additional if it would not be financially viable without carbon revenues. If non-carbon income already makes a project viable, the case for carbon revenue as an enabling condition weakens considerably.
Regional market maturity is a significant determinant of secondary revenue strategy. Commercial ARR projects depend on the depth and accessibility of local timber markets, while biochar producers are similarly constrained by the maturity of physical biochar demand in their operating geography. Where physical biochar markets are less developed, projects become more dependent on carbon credit revenue.
How much carbon credit revenue goes to local communities?
The report finds this is hard to assess, because there is no common reporting framework. Revenue sharing with local communities varies widely, from around 20% to 90%, a spread that reflects definitional inconsistency as much as genuine variation in developer practice. Without a standardized taxonomy, cash transfers, local employment, infrastructure investment, and in-kind services are aggregated under the same metric, rendering cross-project comparison unreliable.
Data provided on benefit-sharing was insufficiently granular for a quantitative analysis. Of the 28 projects that provided information on their benefit-sharing model, 17 used revenue share, 7 used in-kind support, 2 combined in-kind support and revenue share, and 2 used equity. The report sets out the advantages and drawbacks of each model.
To improve transparency, Sylvera proposes minimum standards for crediting bodies and standard-setting organizations, including:
- Benefit-sharing mechanisms designed in direct consultation or collaboration with rightsholders
- Mandatory categorization of benefit-sharing disclosures into direct monetary, in-kind, livelihood, and capacity categories
- A minimum direct monetary benefit share to consider, for example no less than 30–35% of gross carbon revenue for projects on community-titled land
- Benefit-sharing costs disclosed on an annualized, per-tonne basis throughout the crediting period
- Disclosure of whether benefits flow to individual households, community funds, or other entities, and the governance arrangements for those flows
The report also proposes community-endorsed verification, with community sign-off as a formal condition of verification approval.
Is the cost of a carbon credit the same as its price?
No. The report focuses exclusively on the cost of delivering carbon credits: the capital and operational expenditure required to develop, validate, and operate a carbon project. Carbon credit prices are determined by market conditions, buyer demand, and a range of factors beyond project economics.
No inference about market pricing should be drawn from the cost figures in the report.
Why is biochar such high cost?
Biochar carries the highest median levelized cost in the report, at $185 per credit. The report points to several factors:
- Capital intensity and a limited investor base. Biochar and other engineered removal projects face a combination of high upfront capital intensity, a limited investor base, and higher delivery risk stemming from the nascency of these project types.
- Evolving methodologies. Crediting methodologies are still evolving and the operational track record at commercial scale is limited. Both translate into risk premia that increase the cost of capital.
- Scale. The highest-cost project in the dataset (about $544 per credit) operates at the smallest scale, under 500 credits per year. The lowest-cost projects (about $25 to $140 per credit) cluster at annual volumes of around 2,300 credits and above.
- Technology. The wide range of costs likely reflects the variety of pyrolysis technologies in use, along with the distinction between artisanal and industrial biochar.
The report also cites the CDR.fyi/OPIS Durable CDR Pricing Survey (2025), which found that experienced biochar suppliers who had already transacted reported materially higher break-even costs than those who had yet to sell credits. This suggests the true economics of delivery at scale are harder than new entrants anticipate.
Why do ARR credits cost more than REDD+ credits?
Among the two nature-based solutions analyzed, ARR (36percredit)costsconsiderablymorethanREDD+(6). The split between upfront investment and ongoing operational costs reveals how these project types are structurally financed.
ARR involves the establishment of new forest cover, which requires substantial upfront funding for land acquisition, preparation, and initial planting before the longer-term operational monitoring phases begin. As a result, CapEx accounts for 71% of ARR's total levelized cost. The report cites The Climate Trust, which notes that the lag between start-up costs and significant credit issuance can range from around 10 years for the fastest-growing species to approximately 22 years for large-scale post-wildfire restoration projects.
REDD+ projects tend to incur lower capital expenditure because they protect existing forest rather than establishing new cover. CapEx accounts for 20% of their total levelized cost, making their cost structures more operationally weighted. The REDD+ data spans only three countries across two regions, so the $6 median should be treated as directional rather than definitive.
How should buyers use carbon credit cost benchmarks?
The report recommends treating its benchmarks as reference ranges, not precise comparators. Project-specific factors including scale, geography, governance model, and financing structure can produce costs that differ materially from the median without indicating any quality or integrity concern.
The appropriate use of a benchmark is to flag cases where a quoted price sits so far outside demonstrated sector economics as to warrant further explanation, not to enforce a single standard. The report also includes a practical set of questions on cost structure and benefit-sharing for engaging developers directly.
About the report
Finalised in September 2026, the report addresses one of the voluntary carbon market's most fundamental questions: what does it actually cost to deliver a high-integrity carbon credit? It provides a qualitative and quantitative analysis of cost data across multiple project types, alongside an examination of benefit-sharing with Indigenous Peoples and local communities. This cost information is rarely visible to market participants, as most developers treat project economics as commercially sensitive.
The research brings together two organizations with complementary roles. The ICVCM is the independent governance body responsible for setting and maintaining the Core Carbon Principles (CCPs), the market-wide integrity threshold that defines what constitutes a high-quality carbon credit. Sylvera is the leading independent carbon credit ratings and data provider, whose technical relationships with project developers provided access to commercially sensitive data.
What data was included
The cost survey generated 53 responses from project developers actively developing or operating carbon projects across six project types: ARR, biochar, REDD+, cookstoves, regenerative agriculture, and mangroves. Respondents disclosed data across five dimensions:
- Capital expenditure (CapEx)
- Operational expenditure (OpEx)
- Benefit-sharing arrangements
- Secondary revenues
- Cost-of-capital assumptions
Respondents also provided qualitative context on the key factors shaping costs in their project environment. 67% of ARR projects and all cookstove projects in the dataset use CCP-approved methodologies. Survey responses are supplemented by a review of existing literature on carbon project economics and benefit-sharing arrangements.
How the research was conducted
Data was collected through a structured survey across four rounds of outreach to project developers, the last of which was delivered to 1,024 unique developer contacts. Across all four rounds, developer willingness to share cost and benefit-sharing data was strongly contingent on relational trust.
To provide a standardized comparison across different project types and project lifespans, the report uses a levelized cost per credit. This is calculated by annualizing the CapEx, adding the ongoing annual OpEx, and dividing the sum by the annual credit issuance volume. CapEx is annualized using a 10% discount rate, representing a moderate cost of capital scenario that reflects a typical developer based in emerging markets and developing economies. Low (5%) and high (15%) scenarios are also tested.
All submissions were anonymized, and participants were presented with a data licensing agreement setting out the intended use of the data and the anonymization procedures. A minimum threshold of five responses per project type and region was applied, so mangroves and regenerative agriculture were not analyzed further. Two extreme outliers were excluded from the ARR category. Given the sample sizes, survey responses are used to identify directional trends rather than statistically definitive findings.
Read the full report
Download the report here: Understanding the True Cost of a High-Quality Carbon Project.