カーボン市場に関する、最も明確で実用的なインサイト
包括的な価格データ、国別・手法別のリスク分析、専門家の予測に基づき、データドリブンな意思決定を支援
大切なものすべてが繋がっています
価格設定、ポリシー、そして信頼性の指標が、一つのワークスペースで連携され、より迅速で、より情報に基づいた意思決定を実現します。
品質と価格のシグナルが組み合わさった
品質、価格、政策にわたる重要なデータと市場分析を、すべて一つのダッシュボードに統合しております。
専門家による分析を、ご参考までに要約いたしました
当社の専門家は一貫した枠組みを用いて、複雑なデータを比較可能な評価へと変換いたします。

一歩先を行く
過去の買い手動向、リアルタイムの市場データ、シナリオに基づく予測を組み合わせることで、炭素市場の過去、現在、そして未来を理解します。
当社のデータの特徴
市場および価格データの断片化された情報源を、単一の意思決定に即対応可能なビューに置き換え、必要なスピードで行動できるようにします。
典型的な市場データ

複雑な市場をわかりやすく解説いたします
専門家による分析により、複雑な市場データを即座に活用可能な知見へと変換いたします。

50カ国以上の国別・政策リスクをマッピング
50カ国以上の政策リスクと緩和策に関する詳細な評価、ならびに第6条に基づく活動の追跡を含みます。
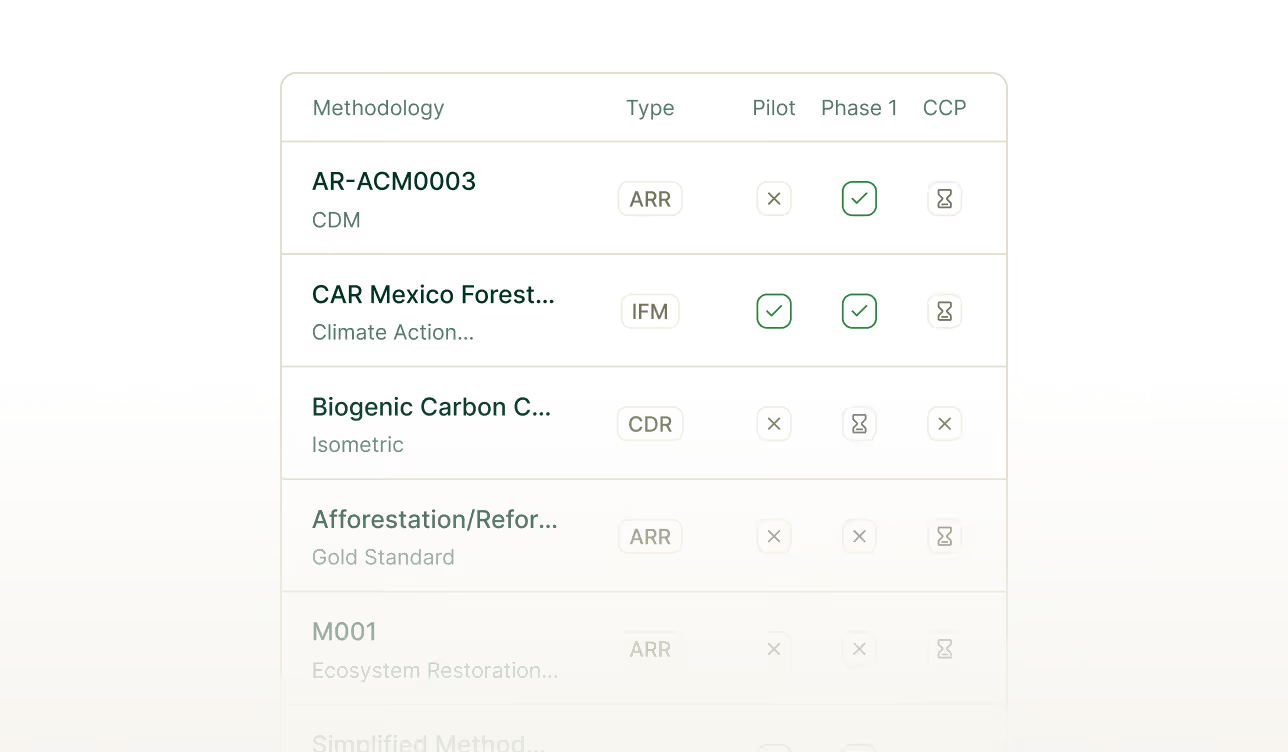
25種類以上の手法を比較しました
最も関連性の高いNBSおよびCDRプロジェクトタイプにおける手法の強みと弱みについての詳細なレビュー。
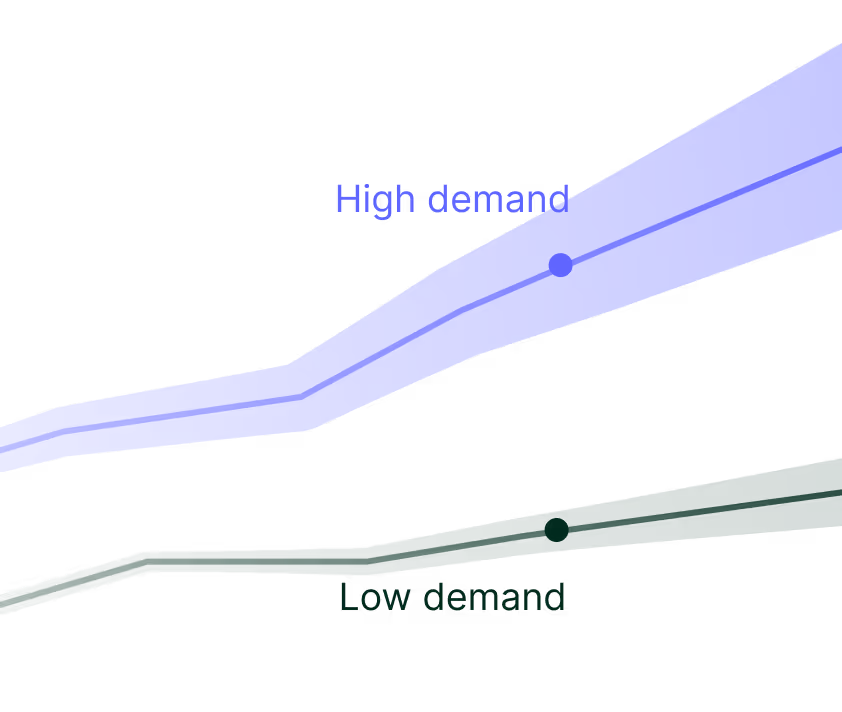
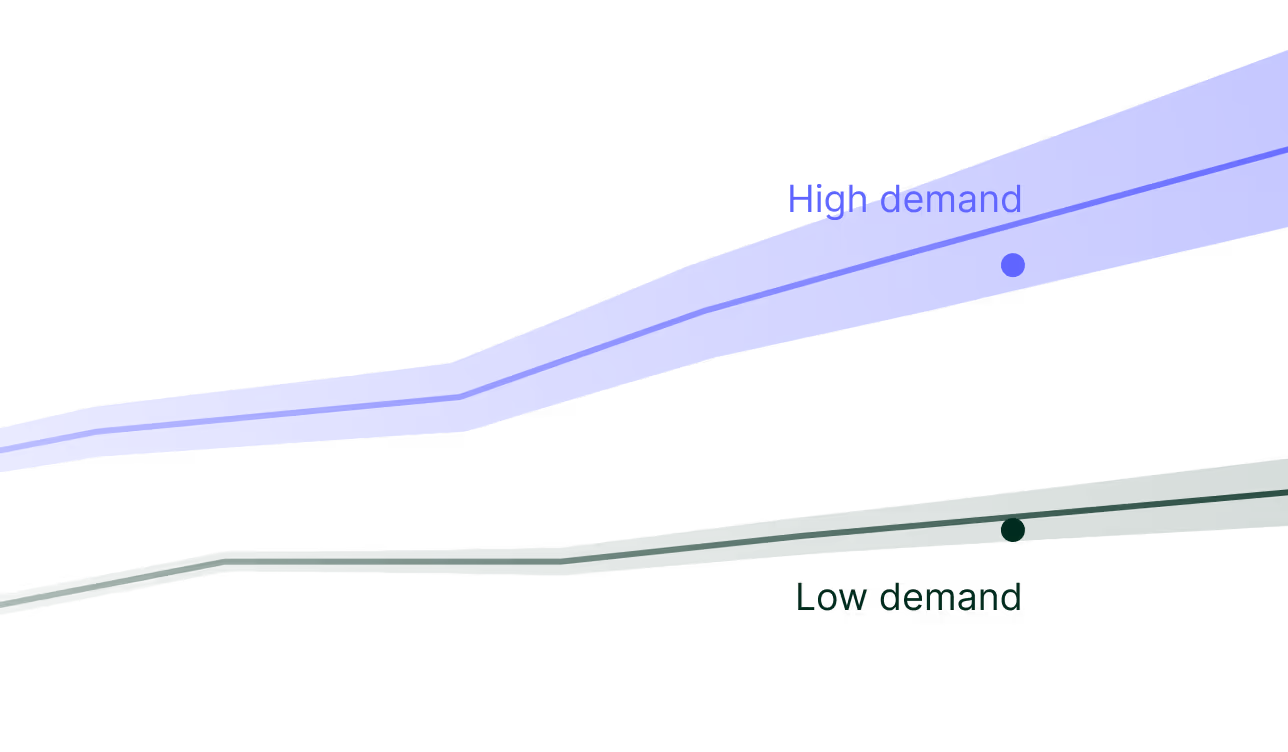
市場予測
2050年までの年間価格、需要および供給の予測。主要なプロジェクトタイプと地域を対象とし、3つの需要シナリオに基づきます。
深い市場カバレッジ
市場カバレッジは十分に深く、確信を持って価格設定、ベンチマーク、戦略立案を行うのに十分なものです。
30万件以上の取引データに基づく推定値で、信頼区間とバックテストによる精度を保証しております。

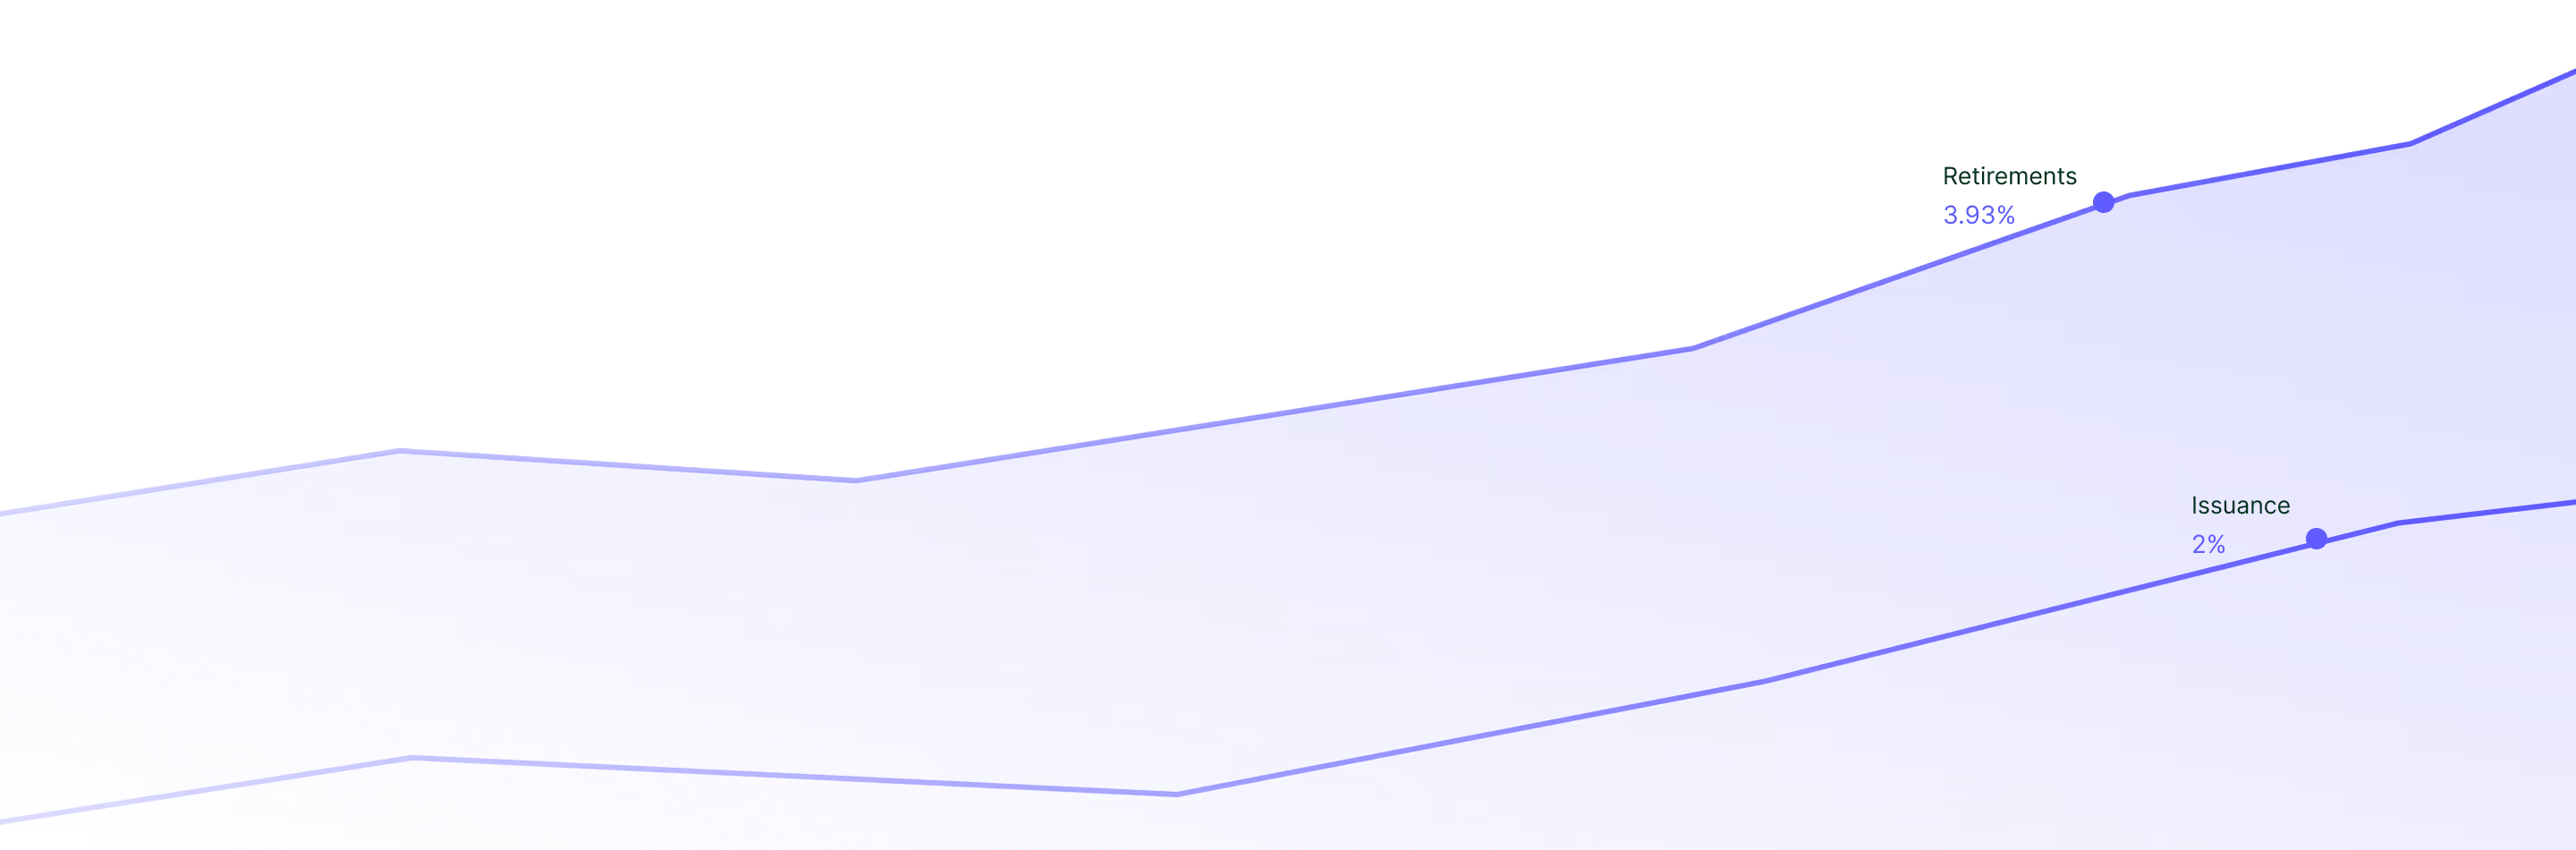
主要なカーボン登録機関からのリアルタイム発行、償却、価格データ。

セクター別、ヴィンテージ別、プロジェクトタイプ別、地域別に閲覧可能な、実用的な需要分析または見込み顧客調査。

プロジェクトの種類や年代を横断したベンチマークを、評価、交渉、およびポジショニングのためにご活用ください。

マーケットインテリジェンスの実践をご覧ください
市場分析から価格決定まで — バイヤー、投資家、開発者がどのようにSylveraを活用してカーボン市場を見極めているかをご覧ください。
よくあるご質問
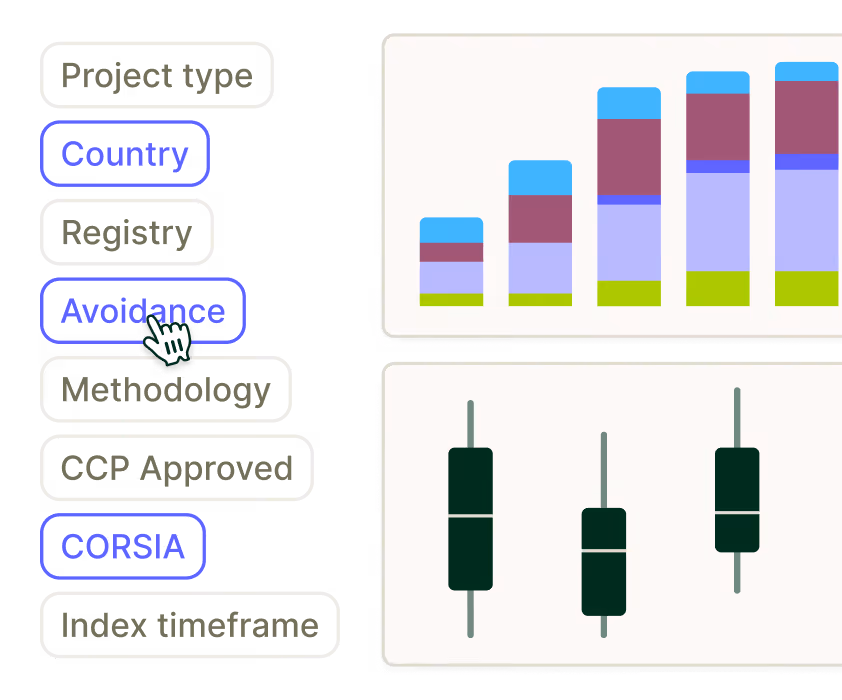
- 信用の健全性に対するリスク: 炭素会計、追加性、永続性、セーフガード、コべネフィット に基づき、プロジェクトの手法を、理想的なベストプラクティスコべネフィット 評価します 。
- 市場受容性と認証適格性: CORSIA パイロットおよびフェーズ1)、CCP、ICROAといった主要スキームや、シンガポール炭素税などの国内プログラムとの整合性を評価します。
方法論プロファイルでは、異なるプロジェクトタイプの方法論間でリスクを比較することができます。この機能は、プロジェクトタイプに関係なく、特定のリスク許容度と気候目標に適合する方法論の選択を可能にすることで、ネット・ゼロ目標との整合性をサポートします。
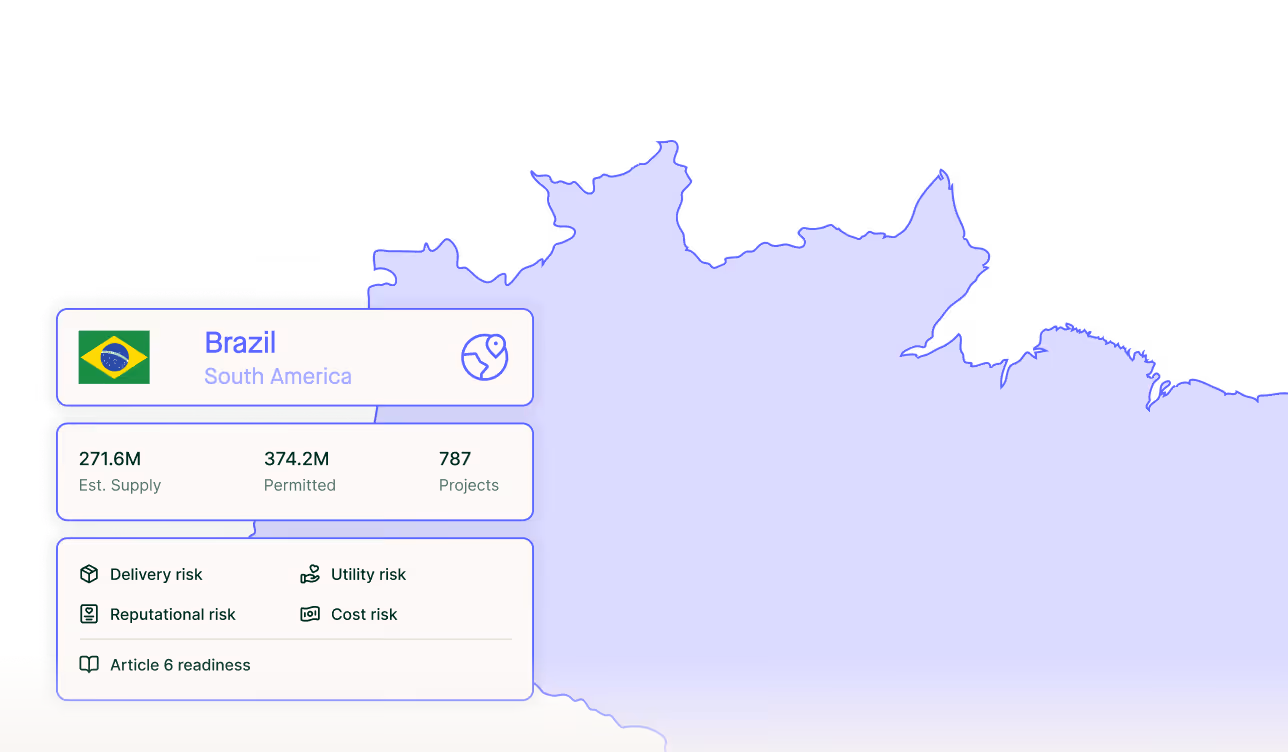
Sylveraカントリー・プロファイルは、カーボンカーボンクレジット プロジェクトのバイヤーや投資家が直面するホスト国に関連する4つの主要リスク(デリバリー、ユーティリティ、レピュテーション、コスト)を評価し、1(低リスク)から10(高リスク)までのスケールで採点します。各リスクは、炭素所有権、取引・利用規制、LOA/CAs の経験など、いくつかのリスク要因によって定義されます。
カントリー・プロファイルは、国別のリスクに関する洞察を提供することで、ユーザが異なる国でプロジェクトが直面する可能性のある潜在的なリスクを評価し、比較することを可能にします。これにより、ユーザーのリスク許容度やネットゼロ戦略に合致する地域を特定し、プロジェクトの成功やコンプライアンスを損なう可能性のある高リスク地域を回避することができます。Sylvera 各国の動向をモニターするため、ユーザーはリスク戦略が最新であることを確認することができます。
7日間の無料トライアルをお申し込みください
実際の投資や調達判断を支える市場および価格データを探求してください。