“Over the years we’ve invested significantly in our field data team - focusing on producing trusted ratings. While this ensures the accuracy of our Ratings, it doesn’t allow the scale across the thousands of projects that buyers are considering.”

For more information on carbon credit procurement trends, read our "Key Takeaways for 2025" article. We share five, data-backed tips to improve your procurement strategy.
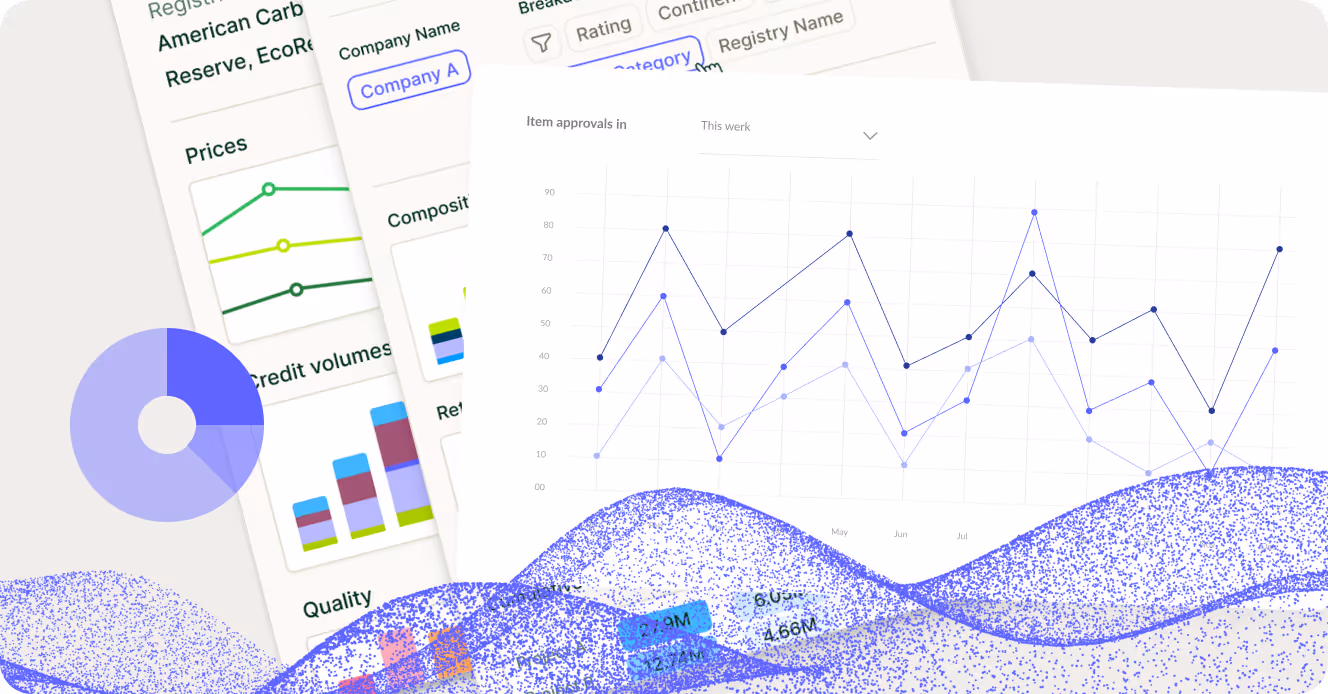
One more thing: Connect to Supply customers also get access to the rest of Sylvera's tools. That means you can easily see project ratings and evaluate an individual project's strengths, procure quality carbon credits, and even monitor project activity (particularly if you’ve invested at the pre-issuance stage.)
Book a free demo of Sylvera to see our platform's procurement and reporting features in action.
Every CDR developer makes the same promise: "Prices are high today, but we'll hit $100/t at scale." Investors and buyers have heard this story many times, and now need clear evidence before deploying capital.
Cost curves are now the most scrutinized part of a CDR pitch, as well as the least transparent. The way to unlock serious offtakes and project finance is to back those curves with transparent assumptions, realistic scalability, and independent validation.
In this article, we unpack what makes a CDR cost curve credible, why third-party assessment matters, and how developers can use rigorousanalysis to improve bankability and negotiate from a position of strength. That way, they can continue to secure financing.
The Cost Curve Problem Everyone Is Dancing Around
"We're at $400/t today, but we'll get to $100/t once we reach 1 Mt/year."
This narrative has become the default pitch across most carbon dioxide removal pathways—from direct air carbon capture (DAC) and bioenergy with carbon capture and storage (BECCS) to biochar and enhanced rock weathering.
The problem isn't that the ambition is wrong. It's that investors and buyers have seen this exact slide too many times, from too many developers—and too few have delivered on the promise.
In addition, corporate buyers now run their own models to stress-test the numbers. Plus, policy and capital increasingly flow toward projects with proven, not projected, unit economics.
Meanwhile, other quality metrics—permanence, MRV, additionality—have become increasingly standardized. Frameworks like the ICVCM Core Carbon Principles and methodologies under Article 6.4 provide clear benchmarks for assessing carbon accounting and durability. Cost curves, by contrast, remain forward-looking and assumption-heavy.
Here's the reality: CDR projects that want to reach a final investment decision (FID) and secure bankable offtakes now need cost curve credibility, not just ambition. The gap between a developer's pitch deck and rigorous techno-economic reality can make or break financing.
Why Cost Curves Need Credibility
Cost projections in the CDR space suffer from multiple issues, which makes credibility essential.
.avif)
Optimism Bias Is Baked In
Almost every CDR project underestimates constraints and overestimates improvement trajectories. Here are a few common areas of underestimation to be aware of:
- Feedstock constraints
- Energy costs and PPA realities
- Storage and transport agreements
- Regulatory delays and permitting
- Ramp-up complexity with downtime
On the flip side, developers consistently overestimate:
- Learning rates
- Capture efficiency improvements
- The speed of scaling from pilot to full commercial operation
In other words, optimism is baked into cost projections for most CDR projects..
Apples-to-Oranges Comparisons Across Pathways
Generic "$100/t at scale" statements are meaningless without context about the CDR pathway.
Direct air capture projects face different economics than BECCS, biochar, or enhanced rock weathering. For example, DAC projects are capital-intensive with high energy requirements but benefit from location flexibility. BECCS projects, on the other hand, depend on biomass supply chains and CCS infrastructure.
Then there are biochar projects, which demand less capital but face feedstock logistics challenges, and ERW projects that require large-scale mineral sourcing and application infrastructure.
Each pathway operates at a different technology readiness level, carries different capital intensity, offers different revenue diversification options, and depends on different policy mechanisms. So, comparing cost curves across pathways without acknowledging structural differences is unfair.
Buyers and Investors Lack Benchmarks
Without peer data, pathway-specific benchmarks, or external techno-economic assessment references, it's impossible for buyers to pressure-test CAPEX, OPEX, capture efficiency, and energy assumptions.
The consequences are significant: Mispriced offtakes that don't reflect delivery costs, under-capitalized projects that can't execute as planned, and sector-level credibility problems that make it harder for all CDR developers to access capital. The voluntary carbon market and emerging compliance mechanisms for carbon removal need reliable economics to scale, but data asymmetry works against everyone.
What Makes a CDR Cost Curve Credible?
Credibility comes from transparency, specificity, and independent validation.
.avif)
Transparent Financial Model Assumptions
A credible cost curve starts with a full cash flow model that includes:
- CAPEX and construction phases
- Detailed OPEX that cover labor, maintenance, consumables, transport, and storage
- Energy costs that reflect PPA terms or grid pricing rather than theoretical renewables pricing
- Feedstock assumptions that account for availability, price volatility, and logistics
- Discount rate and debt structure with clear DSCR and LLCR assumptions.
Developers also need clear rationale for technology costs, capture efficiency projections, learning curves based on analogous technologies or pilot data, by-product revenues that are contractually supported or market-tested, and carbon price trajectories that align with market dynamics.
Pathway-Specific Techno-Economic Assessment (TEA)
Credible assessments use pathway-specific TEA frameworks with detailed cost breakdowns, sensitivity analyses that test multiple scenarios, technology readiness level mapping that acknowledges current maturity, and credible throughput ramp curves based on comparable projects.
The most valuable TEAs also integrate technical scalability analysis:
- What's the TRL and realistic learning path?
- Which bottleneck—feedstock, heat, sorbent, storage—caps delivery in the first 24 months?
- What's the realistic P50 ramp versus the developer's optimistic slide?
- What's the minimum configuration that still meets offtake commitments?
These questions surface constraints that determine if a project delivers on its promises. As such, they're important questions for buyers to find answers to, for both business and climate change reasons.
Revenue Diversification and Policy Alignment
CDR economics depend on more than just carbon credits. Smart developers identify multiple revenue streams and align with policy incentives to ensure financing and profitability.
For DAC projects, this might include synthetic fuels production, enhanced oil recovery where applicable, waste heat or electricity sales, and stacking incentives like the US 45Q tax credit
Then there are BECCS projects, which can generate revenue from electricity or steam sales, biofuels or co-products, and contracts for different mechanisms.
Also worth mentioning, biochar projects benefit from the sale of char, syngas, bio-oil, and tipping fees, while Enhanced rock weathering offers agricultural co-benefits and potential material uses.
Policy and regulatory incentives are also critical to project economics. In the US, 45Q and DOE pilot funding can improve unit economics. UK projects benefit from the GGR contract for difference mechanism and grant programs. EU projects access Innovation Fund support and other mechanisms.
Developers should map which incentives are enablers vs overlapping funding sources, and how incentives interact with additionality and credit claims. This alignment directly affects bankability.
Realistic Pathway to Cost Reduction
It goes without saying, but evidence matters.
Credible cost curves show how unit costs fall over time. Moreover, said cost curves are grounded in logistics and process efficiency gains, energy optimization and waste heat recovery, modular design and replication benefits, and learning curves from analogous technologies with similar scaling dynamics.
Additionally, sensitivity analyses should demonstrate what drives costs most—energy, feedstock, CAPEX overruns, etc.—and how robust the economics are to policy changes and price volatility. This level of specificity separates serious projects from those that only show climate impact on paper.
Independent Validation and Peer Benchmarking
Third-party validation helps address developer optimism. After all, developers need to raise capital and secure offtakes, which creates pressure to present the best-case scenario to buyers.
External assessment agencies can compare projects across projects with consistent methodology. This produces apples-to-apples comparisons within DAC, BECCS, biochar, ERW, and other engineered carbon removal solutions. As such, investors and buyers demand independent perspectives before committing capital.
The Market Is Starting to Demand Proof
The CDR market is maturing at a rapid pace, and the bar for cost curve credibility is higher than ever.
Sophisticated Buyers Are Modelling Economics Themselves
Large corporate buyers—especially those pursuing net zero goals—don't take developer projections at face value. They run internal TEA-style models on offers, stress test pricing under different policy scenarios, and systematically compare projects across suppliers to gauge credibility.
This shift means developers can't rely on information asymmetry. Buyers are building internal expertise to evaluate CDR economics, and projects with weak assumptions get filtered out.
Early Disappointments Have Raised the Bar
When CDR projects overpromise and underdeliver on cost and volume, the entire market notices.
Investors who got burned now demand more evidence before committing capital. Buyers who paid premium prices for credits that haven’t materialized to full value now insist on stronger delivery guarantees.
These issues have created a credibility deficit that affects even well-designed projects.
Policy Volatility Forces Scenario Thinking
Subsidies, tax credits, and Article 6.4 methodologies evolve in real time. The regulatory landscape for carbon capture and storage, as well as engineered CDR, is far from settled.
Buyers increasingly want to see base, downside, and upside scenarios that account for this volatility. How sensitive is the unit cost of carbon removal to specific policy assumptions or energy price changes? Projects that can answer this question have a significant advantage in negotiations.
Financing Gap and FID Risk
Without credible economics, CDR projects struggle to secure project finance, construction debt, and bankable offtakes. Because of this, cost curve credibility is a prerequisite for reaching FID.
Lenders need to feel confident that the projects they support can service debt under realistic operational scenarios. And offtake buyers need to be assured that delivery will happen at the agreed price. Third-party validation provides the independent assessment that both parties require.
How Third-Party Validation Changes the Game
Independent cost curve validation shifts the dynamics of CDR project financing and offtake negotiations. It's essential when starting or scaling carbon removal projects for four reasons:
From Defending Assumptions to Presenting Evidence
Without third-party validation, every financing conversation becomes a negotiation over line items in the developer's spreadsheet. Investors question every assumption. Buyers push back on every projection. Time is wasted on arguments about whose model is right.
Third-party validation establishes a shared, neutral baseline. It turns conversations from "Do we believe you?" to "What scenario are we in?" This shift accelerates negotiations and builds trust.
Enabling Apples-to-Apples Comparisons
When projects are evaluated using a consistent methodology, investors can rank opportunities within and across CDR types. This comparability is crucial for capital allocation decisions.
Developers benefit too. How? They can differentiate based on real strengths like robust TEA, strong policy positioning, or superior technical design rather than making bolder and bolder promises.
Identifying Hidden Risks Early
Independent analysis reveals blind spots related to:
- Feedstock and biomass competition
- Storage access and transport bottlenecks
- Energy source assumptions
- Over-reliance on a single policy instrument
If developers identify these issues early they can address them before offtake or financing negotiations stall. It's far better to discover problems during internal due diligence than during investor due diligence.
.avif)
Strengthening Negotiation Positions
Third-party validated cost curves help justify offtake pricing, support bankability assessments for lenders, and reduce the need for aggressive discounts just to close deals.
Developers with validated economics can negotiate from a position of strength. As such, the credibility that validation produces often translates to better deal terms and higher revenue.
What Credible Cost Curve Validation Looks Like in Practice
The real examples below demonstrate how third-party validation can change project trajectories.
BECCS Example
A developer predicts cost will fall from $350/t to $150/t at scale based on learning assumptions.
An independent review validates the learning potential but flags competition for biomass in the target region, storage and transport costs that exceed initial estimates, and dependence on contract for difference-type support to reach commercial viability.
A scenario analysis then leads to a more realistic ramp timeline, revised offtake structures that better allocate risk between developer, buyer, and state support, and ultimately a more bankable project.
DAC Example
A developer trusts theoretical renewable power pricing and high capture efficiency to hit cost targets.
An independent analysis tests PPAs under different cost paths, models scenarios with less favorable energy pricing and grid constraints, and highlights dependency on 45Q and similar incentives.
The outcome is a better energy strategy that reduces exposure to price volatility, and more grounded pricing in offtake discussions that reflects realistic energy costs rather than optimistic projections.
Biochar Example
A developer assumes rapid scale-up with consistent low-cost feedstock availability.
An independent review tests feedstock sourcing and logistics constraints, considers tipping fees and co-product markets, and highlights the need for robust application and distribution partners.
The outcome is a strategic shift to secure feedstock and partnerships earlier in the development process, plus a revised cost curve and ramp that presents a more bankable profile to investors.
Practical Steps for Developers to Build Cost Curve Credibility
Developers can take concrete action to strengthen their economic case. Here's what we suggest:
Get Your Inputs in Order
Start by assembling a full financial model with detailed cash flow, CAPEX and OPEX breakdowns, and explicit discount rates. Make sure to include a comprehensive TEA and TRL assessment as well.
Next, gather all offtake contracts and term sheets for carbon credits, energy sales, and by-products. Then, map policy and incentive mechanisms for your geography and technology pathway. Finally, prepare investor materials including pitch decks and data room documentation.
Use TEA and Sensitivities as Design Tools
Don't treat TEA as a static appendix to satisfy due diligence requirements.
Instead, run sensitivities on energy prices, policy changes, ramp delays, and CAPEX overruns. Then, use the insights to refine project design, adjust ramp timelines, and allocate risks more effectively.
TEA should be an active tool for project optimization, not another compliance exercise.
Communicate Scenarios, Not Single-Point Certainties
Present credible ranges rather than a single headline number. In a similar vein, show what drives costs under different scenarios and how you plan to manage key risks in each situation.
This approach demonstrates sophistication. Investors will walk away with confidence, knowing that you've thought through every downside case, which is much better than ignoring uncertainty.
Seek Third-Party Validation Early
Don't wait until an investor or buyer demands independent validation.
Proactive assessment can shorten diligence timelines, increase investor confidence, and provide internal reality checks before you lock in assumptions that might crumble under scrutiny.
Remember: Early validation is an investment in your project's ultimate success.
How Sylvera's Pre-Issuance Value Module Supports Durable CDR Developers
Sylvera's Pre-Issuance solution for CDR includes a dedicated Value Module that assesses the financial and strategic viability of CDR projects, and outlines how to improve these projects' bankability.
The Value Module combines qualitative review of pathways to compliance markets including Article 6.4, CRCF, UK ETS, and CORSIA; revenue diversification options beyond carbon credits; and alignment with policy and regulatory incentives like 45Q, GGR CfD, and EU Innovation Fund support.
It also includes quantitative techno-economic assessment of technical scalability and bottlenecks, revenue and cost structure robustness, and market pricing trends vs. project assumptions.
At the end of the day, the Value Module gives developers an independent, third-party view of their cost curve credibility. At the same time, investors and buyers get a consistent, objective basis for comparing projects and structuring offtakes.
Want access to an independent assessment that you can use to strengthen your project's economics, improve its bankability, and accelerate serious offtake conversations? Book a demo of Sylvera for CDR now.
The Key to Successful Carbon Removal Technology Projects
The CDR market is maturing.
Credibility now matters more than ambition. The developers who win will prove their economics with transparent assumptions, realistic ramps, and independent validation—not aggressive projections.
Third-party cost curve assessments de-risks projects while improving strategy via rigorous scenario analysis. As climate targets drive demand for large scale deployment of CDR solutions, the projects that secure financial support will be those that build credibility from the very beginning.