“Over the years we’ve invested significantly in our field data team - focusing on producing trusted ratings. While this ensures the accuracy of our Ratings, it doesn’t allow the scale across the thousands of projects that buyers are considering.”

For more information on carbon credit procurement trends, read our "Key Takeaways for 2025" article. We share five, data-backed tips to improve your procurement strategy.
One more thing: Connect to Supply customers also get access to the rest of Sylvera's tools. That means you can easily see project ratings and evaluate an individual project's strengths, procure quality carbon credits, and even monitor project activity (particularly if you’ve invested at the pre-issuance stage.)
Book a free demo of Sylvera to see our platform's procurement and reporting features in action.
Where a project is located shapes almost everything about its commercial prospects: what it can deliver, which markets it can sell into, and what buyers will pay. The same project type can sell for three times as much in one region as in another. ARR credits average $30.35 in Europe, but $9.88 in Asia.
Using data from our 2027 Developer's Guide, this post looks at why geography matters, how prices vary by project type and region, and how host country authorization is opening, or closing, the door to Article 6 and CORSIA demand.
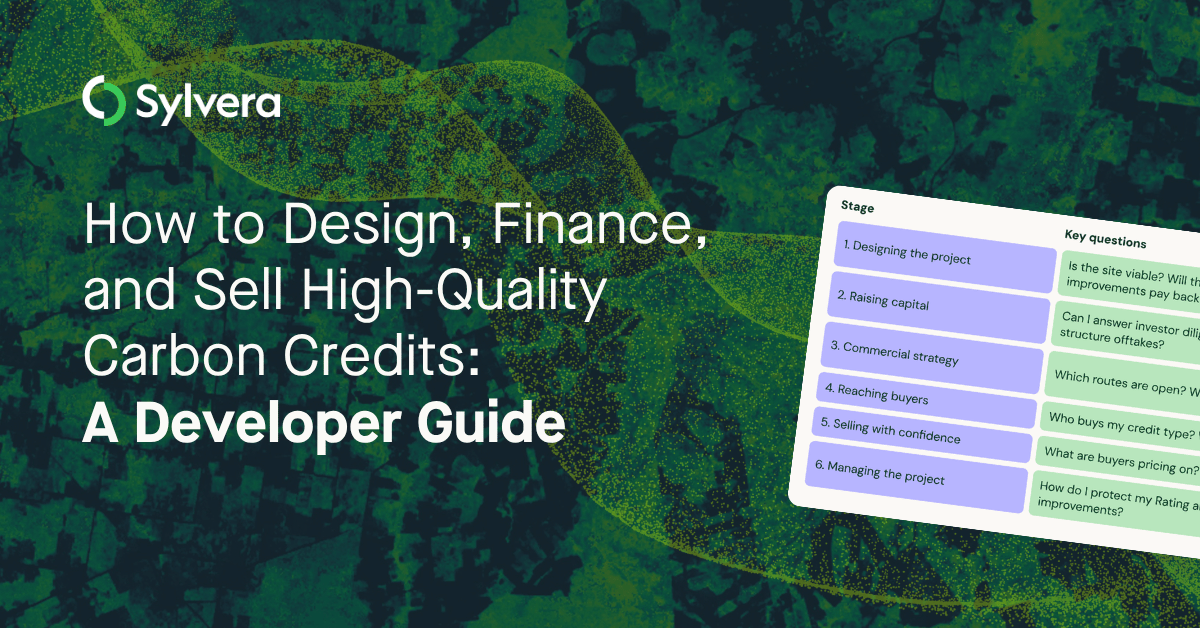
Download the 2027 Developer's Guide to see how your project's location shapes its value, and how to make the most of it. Download the guide

Why geography matters for carbon credits
Geography affects a project in three ways.
Risk. Country risk shapes delivery, pricing, and market access. Four dimensions matter most:
- Delivery risk: political stability, regulatory consistency, and operational challenges.
- Utility risk: infrastructure limitations and access constraints.
- Reputational risk: human rights records and governance.
- Article 6 readiness: how prepared the host country's institutions are for international carbon markets.
Potential. Natural conditions decide how much impact a project can deliver. Growth rates for ARR, the forest carbon stocks behind REDD+ and IFM, and household energy use for cookstoves all vary by region. So does the legal framework for land tenure and carbon rights, which investors check early in due diligence.
Project fit. Because of these differences, certain project types make more sense in certain regions. Market access matters too: projects in Article 6-ready countries can sell into voluntary markets, CORSIA, and bilateral agreements, while projects elsewhere may be limited to voluntary buyers. Evolving domestic registry requirements, as seen in Indonesia, can also create uncertainty for projects that aren't monitoring them.
What the data shows: prices by project type and region
The chart and table below show the average prices and the share of rated projects at BBB or higher, by project type and region.

Source: Sylvera, Q3 2026. — = no data.
Five things stand out.
Nature-based removals vary most by region. ARR prices range from $9.88 in Asia to $30.35 in Europe, a 3.1x spread. IFM is wider still, from $6.68 in Asia to $25.57 in Europe, a 3.8x spread. Even excluding Europe, North American ARR and IFM credits sell for 1.7x and 2.2x the Asian price.
Africa leads on ARR quality. 73% of rated African ARR projects are rated BBB or higher, the highest share of any region, and African ARR credits sell for 34% more than South American ones. Asia has the lowest share of investment-grade ARR and IFM projects, at 26% and 25%, and the lowest prices for both.
REDD+ and cookstove prices barely move with geography. REDD+ averages between $7.02 and $8.15 in every region, a spread of just $1.13, even though Asia's share of BBB-rated REDD+ projects (60%) is almost double North America's (33%). Cookstoves are similarly tight, at $6.33 to $7.08. For these project types, location alone does little to set price.
Biochar is high quality everywhere. Every rated biochar project outside Europe is rated BBB or higher, and prices sit between $155 and $179 in every region.
Renewables are cheapest, except in Africa. No rated renewables projects in any region reach BBB, and prices are low across the board. But African renewables credits average $5.38, nearly 3x the Asian price of $1.81.
Authorization: the gatekeeper for compliance demand
Compliance demand is set to overtake voluntary demand. Voluntary buyers accounted for around 85% of demand in 2025, but that share is expected to fall to around 30% by 2033. To reach most of that compliance demand, a project needs its host country to authorize its credits for international use, issuing a Letter of Authorization (LoA) and applying a corresponding adjustment (CA).
That's where geography becomes decisive. Of the more than 80 host countries Sylvera has assessed, only 21% are high confidence for delivering LoAs and CAs. A further 58% are on a watch-list, with intent and some progress but policy or reporting gaps, and 22% are unlikely to authorize at all.
Countries that deliver tend to have six things in place: participation, institutions, infrastructure, processes, a whitelist of eligible activities, and an NDC strategy. Rwanda, for example, ranks in the top three in Africa for institutional preparedness. For developers, that makes country choice a commercial decision as much as an operational one.
The Article 6 opportunity
Under Article 6 of the Paris Agreement, countries can buy authorized credits to help meet their own climate targets. Sovereign buyers are already setting out sizable demand: Singapore has stated demand of 25.1 million tCO₂e by 2030, and Switzerland 20 million tCO₂e.
But each buyer sets its own criteria, and geography shapes which deals a project can win.
Sources: Singapore NCCS and National Environment Agency; Swiss Federal Office for the Environment; Sylvera Market Commentary.
Two details stand out. Singapore works from host-country specific methodology lists, so what qualifies depends on the bilateral agreement with each country. And exclusion lists differ: a REDD+ project shut out of Swiss deals could still qualify for Singapore, while most renewables projects are excluded from Singapore's program. The same project can qualify in one deal and not another.
The CORSIA opportunity
CORSIA, the aviation industry's offsetting scheme, accepts credits from any host country, but only with the right paperwork. First Phase credits must come from eligible programs and methodologies, carry a 2021–2026 vintage, and have both an LoA and a CA, or qualifying insurance against an adjustment not being applied.
The demand is real and growing fast. Retirements of CORSIA-eligible credits jumped from 1.52 million in 2025 to 14.2 million in January–September 2026, reaching 10.7% of all retirements. Airlines named as retiring CORSIA-eligible credits so far in 2026 include Singapore Airlines, Japan Airlines, Scoot, and Ryanair. Demand for CORSIA-eligible credits is projected at 150–210 million by 2030, if implemented as planned.
With the First Phase compliance deadline in January 2028, airlines are procuring now. For projects in countries that can deliver authorization, that's a significant source of demand. For projects in countries that can't, it may remain out of reach.
What buyers look for when choosing regions
Buyers look at geography long before they look at price. Procurement and legal teams assess country risk when structuring offtake contracts, and investors triage on geography before anything else. They tend to ask:
- Is the host country stable? Political stability, regulatory consistency, and a credible legal framework for land tenure and carbon rights all reduce delivery risk.
- Can the project deliver? Infrastructure, access, and physical risks such as fire, flooding, and drought vary by region.
- Is there reputational risk? Human rights records and governance issues in a host country can reflect on the buyer's own claims.
- Can the credits be authorized? For compliance buyers, a credit without an LoA and CA may not count toward their obligation at all.
- How do projects in this region rate? The share of investment-grade projects varies widely by region and project type, so buyers look for an independent quality signal on the specific project, not just the country.
What this means for developers
- Match project type to region. Regional price spreads are widest for ARR and IFM, so site selection has the biggest price impact for those project types. For REDD+ and cookstoves, quality and co-benefits do more to differentiate than location.
- Treat authorization as a commercial variable. Check your host country's progress on LoAs and CAs early. It decides whether Article 6 and CORSIA demand is open to you.
- Know each buyer's criteria. Article 6 buyers set their own exclusion lists and methodology requirements, so the same project may suit one buyer and not another.
- Benchmark against your region, not the global average. Compare your price and Rating with similar projects in the same geography to see whether you're underpricing.
Get the full picture
Geography is one part of the story. The 2027 Developer's Guide covers the full journey, from site selection and fundraising to choosing your commercial route, reaching buyers, and keeping your Rating current, with the data you need at every stage.
Download the 2027 Developer's Guide to see how your project's location shapes its value, and how to make the most of it. Download the guide