"Ao longo dos anos, investimos significativamente em nossa equipe de dados de campo, com foco na produção de classificações confiáveis. Embora isso garanta a precisão de nossas classificações, não permite a escala dos milhares de projetos que os compradores estão considerando."

Para obter mais informações sobre as tendências de aquisição de créditos de carbono, leia nosso artigo"Key Takeaways for 2025". Compartilhamos cinco dicas baseadas em dados para aprimorar sua estratégia de aquisição.
Mais uma coisa: os clientes do Connect to Supply também têm acesso ao restante das ferramentas da Sylvera. Isso significa que você pode ver facilmente as classificações dos projetos e avaliar os pontos fortes de um projeto individual, adquirir créditos de carbono de qualidade e até mesmo monitorar a atividade do projeto (especialmente se você investiu no estágio de pré-emissão).
Agende uma demonstração gratuita do Sylvera para ver os recursos de compras e relatórios da nossa plataforma em ação.
Podemos aprender muito com o mapeamento da estrutura florestal. Qual é a biomassa média dessa espécie de árvore no nordeste dos Estados Unidos ou no Brasil? E, consequentemente, quanto carbono elas podem armazenar? Além disso, o que os dados podem nos dizer sobre o meio ambiente, a fertilidade do solo e nossas táticas gerais de manejo florestal? Há algo que possamos fazer para melhorar a produtividade florestal na região?
O mapeamento da estrutura das florestas é uma atividade importante, e é por isso que muitas entidades diferentes, desde corporações individuais até o Serviço Florestal do USDA, se dedicam a essa tarefa.
O que é biomassa?
A biomassa pode ser definida como a massa seca em pé de matéria viva ou morta de plantas lenhosas, e geralmente é expressa como uma massa por unidade de área (por exemplo, megagramas por hectare: Mg ha-1). É uma variável essencial usada para monitorar o carbono liberado e sequestrado pelos ecossistemas de terras florestais porque aproximadamente 50% da biomassa é carbono. Neste artigo, nos referimos à biomassa acima do solo, pois essa é a única parte que podemos "ver" usando a tecnologia de sensoriamento remoto por satélite.
Medição da biomassa florestal
Medir a biomassa de árvores e arbustos não é fácil. De fato, a única maneira de medir diretamente a biomassa é por meio de amostragem destrutiva, em que as árvores e os arbustos são cortados e pesados.
Essa abordagem destrutiva é demorada, cara e contraproducente, pois queremos manter o carbono na vegetação em vez de liberá-lo novamente na atmosfera (o que provavelmente acontecerá com as árvores cortadas ao longo do tempo). Entretanto, esse método é necessário para desenvolver modelos alométricos.
As alometrias são usadas para estimar a biomassa a partir de parâmetros fáceis de medir, como o diâmetro e a altura da árvore. Ela se baseia na teoria da escala biológica e descreve as dependências dos organismos vivos em termos de massa corporal, tamanho e forma.
Os modelos alométricos são usados por especialistas em ecologia florestal e cientistas ambientais em inventários florestais tradicionais para calcular a biomassa das árvores. Os inventários florestais se baseiam no estabelecimento de parcelas de campo na região de interesse para estimar estatísticas florestais de grandes áreas. No entanto, muitos países tropicais ricos em florestas não executam programas de inventário florestal, ou estão apenas começando a implementá-los, devido à distância dos locais e aos custos envolvidos.

Ao medir a biomassa florestal usando métodos tradicionais de inventário florestal, estamos expostos a várias fontes de erro, como a medição manual das dimensões das árvores, as estratégias de amostragem e os modelos alométricos. As estimativas alométricas de biomassa geralmente são tendenciosas(Demol et al. 2022), com diferenças de 15%(Burt et al., 2021) ou até 30%(Calders et al., 2015, Gonzalez de Tanago et al., 2018). As parcelas de inventário florestal são medidas durante longos períodos de tempo (por exemplo, ciclos de 5 anos), usando diferentes metodologias, projetos de amostragem, tamanhos/formas e operadores, o que pode levar a grandes discrepâncias ao avaliar diferentes projetos e regiões. Além disso, não temos dados de referência de muitas áreas das florestas do mundo devido à inacessibilidade e/ou ao custo muito alto. Isso faz com que o acesso a dados de referência de boa qualidade seja um dos principais desafios no monitoramento dos estoques de biomassa.
Por isso, geralmente evitamos o termo "dados de verdade" e preferimos o termo "dados de referência". Os dados de referência são cruciais no sensoriamento remoto e na ciência de dados, pois, para qualquer modelo que você desenvolva, sempre se aplica a regra de ouro "lixo dentro é igual a lixo fora". É por isso que, na Sylveradamos atenção especial aos nossos dados de referência.
Criando o melhor conjunto de dados de referência: lidar em várias escalas para o Biomass Atlas
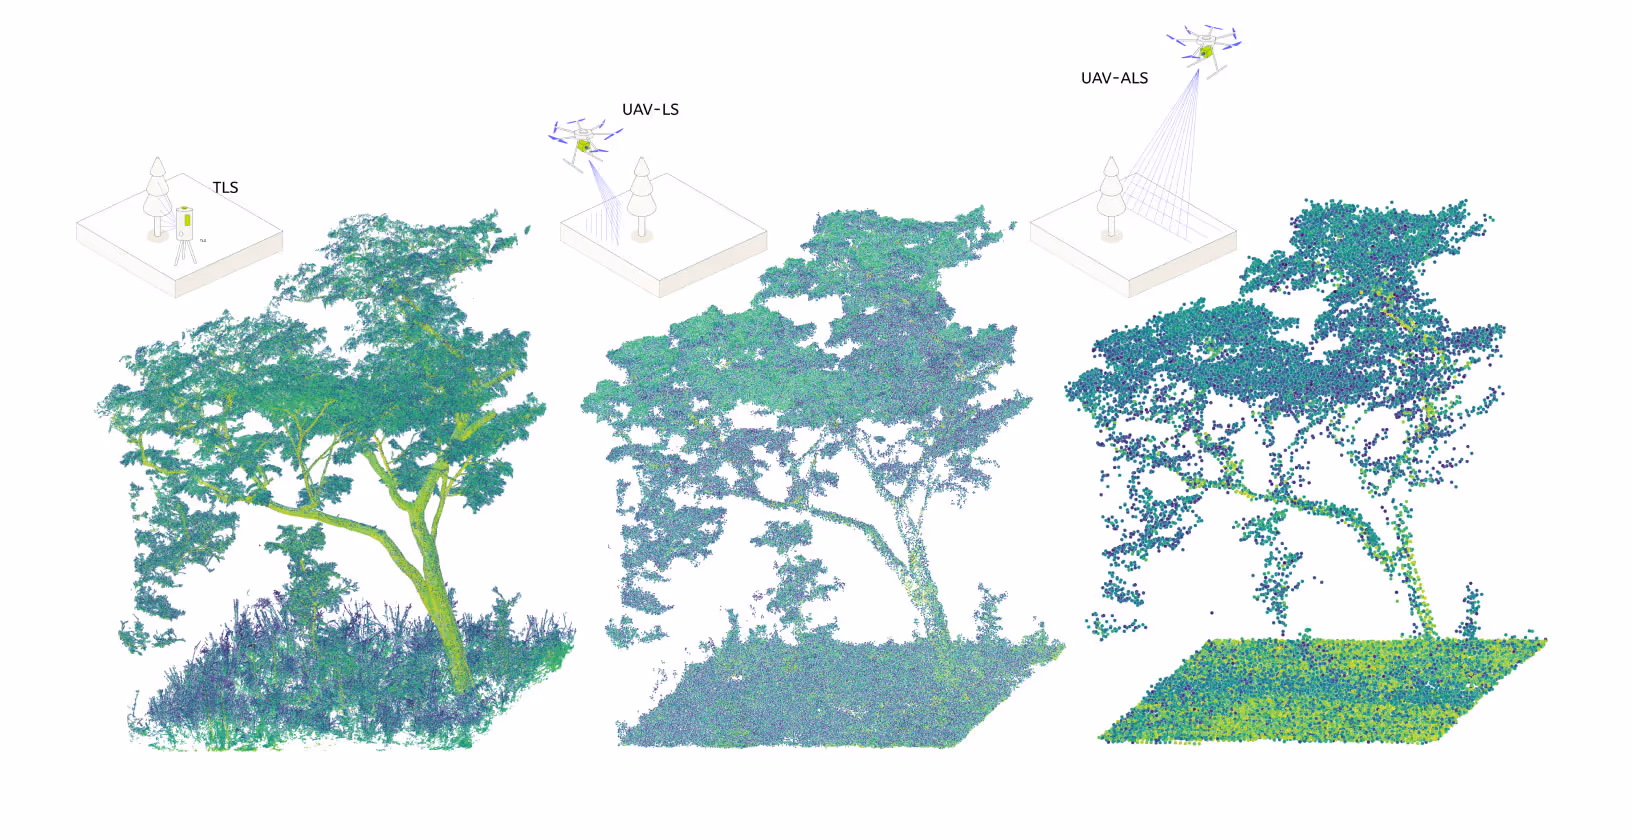
Para isso, visitamos florestas em todo o mundo e as escaneamos a laser a partir do solo e do ar usando nossos métodos proprietários de lidar em várias escalas (MSL). Coletamos dados 3D (ou seja, nuvens de pontos) no solo usando nossos scanners a laser terrestres (TLS). Esses scanners podem registrar a estrutura de árvores individuais com precisão milimétrica, até os galhos e folhas individuais. Também coletamos dados semelhantes de nossos scanners a laser aéreos (ALS) montados em veículos aéreos desocupados (UAVs), o que nos permite coletar dados em áreas maiores.
Essa abordagem Lidar em várias escalas - combinando TLS, varredura a laser por UAV e varredura a laser aerotransportada - é a base do Biomass Atlas. Criado com base em mais de US$ 10 milhões em campanhas de campo exclusivas em mais de 250.000 hectares em 5 continentes, ele representa o conjunto de dados de referência de biomassa mais abrangente já reunido.

Esses novos conjuntos de dados contêm grandes quantidades de informações sobre a estrutura da floresta e a biomassa acima do solo. No entanto, o acesso a essas informações é complexo.
A extração de dados sobre árvores individuais nos permite reconstruir e modelar cuidadosamente os parâmetros em escala de árvore, como a biomassa acima do solo. Podemos medir a biomassa das árvores com uma margem de erro potencialmente tão baixa quanto 3%(Burt et al, 2021) em comparação com medições destrutivas de árvores (em comparação com o erro de até 30% mencionado anteriormente ao usar alometrias).
Usando essa tecnologia MSL, o Biomass Atlas é o conjunto de dados de biomassa de referência mais preciso já reunido. Somos capazes de escanear até 50.000 ha de floresta em uma campanha de campo MSL. Os dados de referência MSL podem ser produzidos em diferentes resoluções espaciais, o que permite um melhor aprimoramento dos dados usando imagens de satélite. Usando os dados de biomassa do MSL, também podemos criar nossa própria calibração de biomassa de pegadas LiDAR espaciais adquiridas pelo sensor Global Ecosystem Dynamics Investigation (GEDI) e aprimorar nosso conjunto de dados de referência.
Esses conjuntos de dados alimentam o Biomass Atlas e também nos ajudam a monitorar a saúde das florestas ao longo do tempo e a fornecer classificações confiáveis para todos os projetos de créditos de carbono baseados em florestas.
Como podemos ampliar nossas medições de biomassa para outros períodos de tempo e em grandes áreas?
Nossa tecnologia MSL pode medir a biomassa com incrível precisão, mas a quantidade de área que podemos cobrir e o número de vezes que podemos medir são limitados pelo tempo que podemos gastar coletando dados e pelo custo dessa atividade (cerca de dezenas de milhares de hectares por campanha de campo).
A tecnologia de sensoriamento remoto por satélite é fundamental para monitorar os estoques de biomassa, pois nos permite fazer isso com mais frequência (por exemplo, anualmente), em períodos mais longos (por exemplo, de 2000 até o presente) e em escalas espaciais maiores (por exemplo, jurisdições regionais/nacionais) em comparação com os inventários florestais.
Os padrões atuais de contabilização de carbono dependem do uso de imagens de satélite para detectar atividades dentro de projetos de compensação de carbono (por exemplo, desmatamento, novas florestas plantadas) e combiná-las com valores médios de biomassa ou fatores de emissões de carbono para determinar a quantidade de carbono armazenada pelas florestas e a quantidade de carbono liberada por cada atividade. Esses valores médios são calculados em nível de projeto a cada 5 a 10 anos e são baseados em medições manuais de parcelas de campo.
Infelizmente, o período entre as medições é tão longo que uma grande quantidade de mudanças devido a distúrbios florestais (ou seja, emissões) pode ser perdida. Na maioria das vezes, esse tipo de trabalho apresenta deficiências importantes de amostragem (por exemplo, poucas amostras) devido ao custo, à intensidade da mão de obra e à inacessibilidade de algumas áreas remotas. Além disso, os valores médios são um descritor cada vez mais ruim à medida que a variação aumenta (especialmente em relação às deficiências de amostragem mencionadas acima), e a maioria das florestas em que estamos interessados apresenta muitas variações estruturais, o que pode afetar a estimativa dos estoques de biomassa e das emissões de carbono.
As parcelas de inventário florestal nunca foram projetadas para serem usadas em combinação com pixels de observações de satélite. Os dados coletados manualmente no solo podem diferir enormemente das medições de satélites remotos em termos de resolução espacial e cobertura. Portanto, geralmente são introduzidas discrepâncias quando se tenta gerar produtos derivados de sensoriamento remoto de parede a parede.
Atlas de Biomassa resolve esses problemas treinando modelos usando nossos conjuntos de dados de referência de última geração baseados em MSL e nossos dados GEDI calibrados internamente com as melhores imagens de satélite disponíveis publicamente. Essa abordagem nos permite remover ou minimizar essas discrepâncias ao treinar nossos modelos.
Aumentamos nossas estimativas de biomassa em grandes áreas e escalas de tempo usando o radar de abertura sintética (SAR) de comprimento de onda longo. Essa tecnologia consegue "enxergar" através das nuvens e tem alta sensibilidade à biomassa, além de imagens de satélite ópticas multiespectrais que, apesar de terem menos sensibilidade à biomassa, têm uma cobertura temporal mais longa e contêm outras informações úteis relacionadas ao conteúdo de clorofila da vegetação. Também usamos outras informações, como modelos digitais de terreno e análise de textura espacial.

As florestas são sistemas ecológicos muito diversos que apresentam comportamento complexo em diferentes escalas temporais e espaciais. Portanto, os algoritmos de aprendizado de máquina não paramétricos, que fazem menos suposições sobre a forma e a distribuição dos dados de referência, geralmente superam os métodos paramétricos(Evans et al., 2009). Os modelos de aprendizado de máquina podem ser usados para estimar a quantidade e a distribuição espacial da biomassa e sua incerteza. Com esses métodos, também podemos estimar outros parâmetros estruturais da floresta, como a altura do dossel ou a fração de cobertura das árvores.

O Biomass Atlas usa abordagens de última geração revisadas por pares para monitorar a biomassa acima do solo(Rodriguez-Veiga et al, 2020, Meyer et al, 2019, Rodriguez-Veiga et al, 2019). Também realizamos validações estatisticamente rigorosas e análises de incerteza, e seguimos as práticas recomendadas(Duncanson et al, 2021McRobertset al, 2022). Nossos modelos são treinados regionalmente para estimar de forma rotineira e robusta séries temporais de biomassa florestal acima do solo e estoques de carbono a partir de dados de satélite.
O resultado é uma oferta de produto que oferece:
- Densidade de biomassa acima do solo com resolução de 30 m e altura do dossel para qualquer local do mundo
- Cobertura temporal completa de 2000 até o presente com atualizações anuais (trimestrais a partir do primeiro trimestre de 2026)
- Estimativas de incerteza para cada pixel
- Erros abaixo de 9% em escala típica de projeto pequeno (400-7.000 hectares)
- Entrega rápida de API - dados em horas ou dias, não em meses
- Cobertura global de parede a parede em todas as regiões florestais
Nossos métodos são constantemente aprimorados por meio da aquisição contínua de dados MSL para aumentar nossa cobertura, da preparação para as próximas missões de satélite (por exemplo, missão NiSAR e Biomassa) e da incorporação das mais recentes inovações de nossa própria pesquisa e da literatura científica. Nossas metodologias são revisadas interna e externamente pelos principais acadêmicos da área. Também colaboramos com equipes de pesquisa da UCLA, da Universidade de Leicester e da University College London.
Por que precisamos monitorar a biomassa lenhosa em Sylvera?
Na Sylvera , avaliamos projetos de carbono pertencentes a estruturas de carbono, como a Redução de Emissões por Desmatamento e Degradação Florestal. Dois dos componentes mais importantes desses projetos são os dados de atividade e os fatores de emissão, que são usados para calcular as emissões.
Os dados de atividade podem ser avaliados usando técnicas de classificação de cobertura de terra em imagens de satélite, enquanto os fatores de emissão podem ser avaliados usando nossas próprias medições de biomassa. Como alternativa, podemos comparar as emissões relatadas pelos projetos com nossas próprias estimativas derivadas de dados de séries temporais de biomassa.
O Biomass Atlas fornece esses produtos de séries temporais de biomassa que proporcionam mais informações sobre onde e quanto carbono está mudando nas áreas do projeto, além de oferecer uma oportunidade de detectar e avaliar as emissões de carbono derivadas da degradação florestal (o segundo "D" em REDD+).
Quando uma floresta está degradada, ela ainda existe, mas sofreu uma redução em sua capacidade de produzir serviços ecossistêmicos, como o armazenamento de carbono. Isso é de grande importância porque uma grande proporção das emissões de carbono pode se originar da degradação florestal, que em muitos casos não é relatada e, ao mesmo tempo, pode ser o trampolim para um processo de desmatamento.
O monitoramento da biomassa por satélite nos permitirá melhorar nossas classificações avaliando as emissões do desmatamento e da degradação florestal relatadas pelos projetos, mas também as emissões originadas pela degradação florestal em projetos que não as relataram.
Além de alimentar as classificações da Sylvera, o Biomass Atlas está disponível como um produto independente para todos os participantes do mercado - desenvolvedores de projetos, registros, governos e investidores - que precisam de dados de biomassa precisos e defensáveis para suas próprias necessidades de verificação, monitoramento ou due diligence.
Sobre os cientistas pesquisadores da Sylvera
Os pesquisadores que se concentram na biomassa em Sylvera fazem parte de duas equipes: a equipe MSL, responsável pela aquisição e processamento de dados MSL, e a equipe de Aprendizado de Máquina (ML), encarregada de desenvolver métodos para aumentar as medições de biomassa em nível de projeto e regional usando a tecnologia ML.
A liderança da equipe de pesquisa inclui:
O Dr. Miro Demol é um cientista da MSL Lidar que investiga as aplicações da varredura a laser na silvicultura, com um interesse especial na estimativa da biomassa acima do solo e sua incerteza.
O Dr. Andrew Burt é um cientista de sensoriamento remoto e ecologista de florestas tropicais da equipe do MSL que, na última década, ajudou a ser pioneiro no uso de escaneamento a laser em florestas.
O Dr. Pedro Rodríguez-Veiga é cientista sênior de pesquisa de observação da Terra na equipe do ML, com mais de 12 anos de experiência no campo da silvicultura, recuperação de biomassa acima do solo usando sensoriamento remoto e monitoramento florestal.
Um melhor manejo florestal pode ajudar a mitigar as mudanças climáticas
Não podemos ajudar com resíduos de madeira urbana. Mas se você quiser obter as estimativas de biomassa florestal mais precisas disponíveis - seja porque você é um proprietário de terras florestais tentando produzir créditos de carbono ou uma empresa procurando comprá-los - você precisa ter acesso à pesquisa aprofundada e aos conjuntos de dados da Sylvera.
O Biomass Atlas, desenvolvido com base em mais de US$ 10 milhões em campanhas de campo LiDAR em várias escalas, usa uma abordagem proprietária que envolve a tecnologia LiDAR para medir a biomassa acima do solo, o que levou a erros abaixo de 9% em escala de projeto - uma precisão muito maior do que os modelos alométricos podem oferecer.
Se você estiver:
- Um desenvolvedor de projetos que busca obter financiamento mais rapidamente com a validação independente da linha de base
- Uma infraestrutura de verificação de construção de registro com recursos de monitoramento contínuo
- Um governo que estabelece linhas de base confiáveis para programas de REDD+ ou do Artigo 6
- Um investidor que realiza a devida diligência em reivindicações de estoque de carbono
O Biomass Atlas fornece dados de biomassa precisos e fornecidos pela API (disponíveis em horas, não em meses) que transformam a medição de carbono e a avaliação de projetos.
Solicite acesso ao Biomass Atlas para saber mais sobre como os dados de biomassa mais precisos do mundo, alimentados por LiDAR em várias escalas e fornecidos via API, podem apoiar sua estratégia de carbono.