「私たちは長年にわたり、信頼できる格付けの提供に注力し、現地データチームへの投資を重ねてきました。これにより当社の格付けの正確性は確保されていますが、購入者が検討している数千のプロジェクトにわたるスケールを実現することはできません。」

カーボンクレジット調達の最新動向について詳しくは、当社の記事「Key Takeaways for 2025」をご覧ください。調達戦略を改善するための、データに基づく5つのヒントをご紹介しています。
加えて:Connect to Supplyをご利用のお客様は、Sylveraのその他のツールもご利用いただけます。プロジェクトの格付け確認や強みの評価、高品質なカーボンクレジットの調達に加え、プロジェクトの進捗状況のモニタリング(特に発行前段階で投資している場合)も可能です。
Sylveraの無料デモを予約して、調達機能やレポーティング機能を体験しましょう。
ローリー・トレビアン・トーマスとAaron Tam 、Sylvera マーケット・インテリジェンス・スイートに関するデモを開催しました。
このセッションでは、スポット価格、オフテイク価格、市場予測という、カーボンクレジット 価格設定に焦点を当てた3つの機能を取り上げ、市場参加者が戦略的意思決定のために、このきめ細かな価格設定データをどのように活用できるかを、1つの場所で紹介しました。
概要3種類のカーボンクレジット 価格データ
買い手、売り手、投資家は、炭素市場を効果的に運営するために、3つの異なるカテゴリーの価格情報を必要とします:
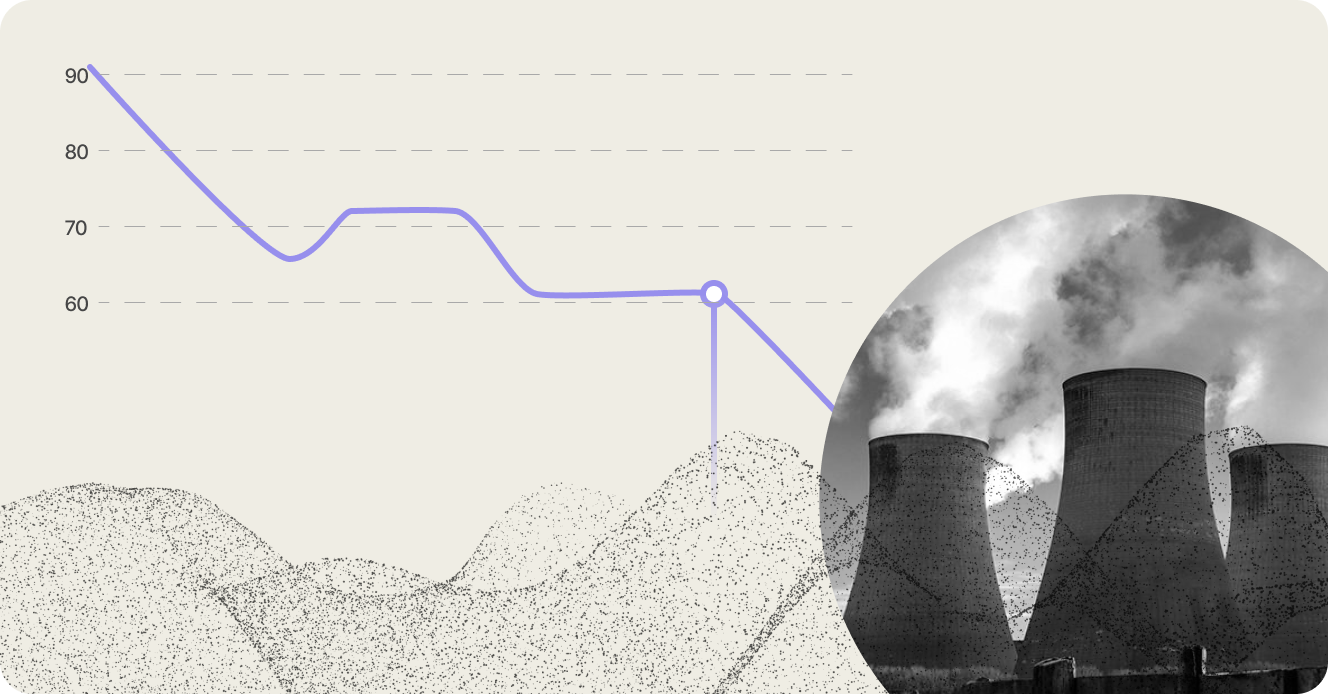
1.スポット価格は即時受渡し市場を表し、過去のほとんどの取引がここで行われています。これらの価格は、参加者がクレジットを供給する場合も購入する場合も、自信を持って取引を決定するために不可欠な基準点となります。
2.オフテイク価格はフォワード市場に焦点を当てたもので、過去3~4年の間に牽引力を得たばかりの比較的新しい分野です。これはデータユニバースがはるかに小さいことを表していますが、高品質のクレジットの安定した量を確保する必要がある5-10年先を計画している企業にとって、より関連性が高い可能性があります。
3.市場予測は、即時の取引ではなく、戦略的な長期計画のために設計されています。これらの予測は、過去のデータでは対応できない重要な疑問にお答えします:
- 特定のプロジェクト・タイプにおける今後の市場規模は?
- 政策の変更は価格にどのような影響を与えますか?
- 特定のクレジット・カテゴリーに対する2030年の需要は?
スポット価格:プロジェクト別価格と取引総額
これらの推定値には信頼度ラベルが含まれており、新鮮で高頻度のデータを持つプロジェクトには「高信頼度」の指定がなされます。このモデルは高い精度を示しており、その後2週間にわたり、90%の推定値が実際の価格から1ドル以内の誤差に収まっています。
ユーザーは、価格、品質、推定 供給、プロジェクト推進者、コンプライアンス適格性などのフィルターを使用して、Sylvera23,000件のプロジェクトカタログを効率的にナビゲートすることができます。
プロジェクト・レベルでは、Sylvera独自の見積もりとアライド・オフセットの評価という2つの独立した価格ビューが統合され、ユーザーは2つのソースにわたって検証を行うことができます。個々のプロジェクトのページには、6ヶ月間の価格履歴と信頼性の指標が表示されます。
この価格データを集計することで、市場全体の分析が可能になります。ユーザーは、プロジェクトのタイプ別に価格分布を分析し、平均値だけでなく、カテゴリー内の大きなばらつきを明らかにする四分位範囲を調べることができます。
このデータセットは、どのようなプロジェクト属性が割高な価格設定を要求しているのかを理解する上で特に有効です。例えば、特定の方法論を用いたARRプロジェクトやコンプライアンス・システムが価格を押し上げています。
このプラットフォームは、Sylvera 格付けとコベネフィット・スコアで価格をセグメント化し、より高い品質特性と価格プレミアムの相関関係を実証しています。
また、すべてのデータはAPI経由でアクセス可能で、オフライン分析や時価評価の練習に利用できます。
オフテイク価格:先物取引
このオフテイク・トラッカーは、将来を見据えた取引のための市場の透明性における重要なギャップに対処するものです。データベースは、耐久性のあるCDRと自然ベースのソリューションの両方にわたる多様な取引構造を表す200の個々のオフテイクをキャプチャします。
ダッシュボードは複数の分析レンズを提供します。中央値表は、各カテゴリー内で大きなばらつきがある、様々なプロジェクトタイプの出発点を提供します。例えば、特定のバブルにカーソルを合わせると、45,000トンで1トンあたり75ドルのShopifyとPachamaの取引のような取引が表示されます。
このきめ細かなビューは、一見似たようなプロジェクト・カテゴリーであっても、コスト構造、プロジェクトの特性、買い手の支払い意欲によって価格にどのような違いが生じるかを理解するのに役立ちます。
関連するバイヤーを特定したいプロジェクト開発者や、サプライヤーの状況を把握したいバイヤーにとって、このプラットフォームは主要な市場参加者とその取引パターンを細分化します。例えばマイクロソフトをクリックすると、同社が契約したオフテイクの量、プロジェクトタイプ、サプライヤーなどが表示されます。このデータベースはまた、四半期や納期ごとの数量や、技術ベースのCDRプロジェクトの計画容量に関する洞察も追跡します。
市場予測戦略立案のためのエージェントベースモデリング
カーボン・クレジット市場には、これまで高度な予測を妨げてきた独特の課題があります:
1.カーボン・クレジット市場は相互に深くリンク
2.極端な価格差別化 存在
3.複雑な政策が需要を形成
Sylvera市場予測は、炭素市場分析における根本的なブレークスルーを象徴するものです。私たちのエージェントベースのモデリングは、市場を総体的な商品として扱うのではなく、個々の需給ソースを表現することで、これらの問題を解決します。
このモデルでは、データベースに登録されている2万件のプロジェクトを、それぞれ異なる特徴を持つ個々のエージェントとして組み込んでいます。そして、自主的な市場については産業セクターごとに、規制市場については個々のコンプライアンス・スキームごとに集計します。
このきめ細かなアプローチは、従来のモデルが見逃していた市場のダイナミクスを捉えます。例えば CORSIA規制が変更され、その市場が自主的な買い手にも供給するプロジェクトによって提供される場合、このモデルはCORSIA 政策のシフトが自主的な市場の価格設定にどのように波及するかを追跡します。このような相互関連性が現実の炭素市場を定義しています。
供給サイドのモデリングでは、既知のプロジェクト(登録済み、現在発行中または発行前)と将来の潜在的なプロジェクト(まだ登録されていない新規投資)を区別します。
需要側モデリングでは、自主的需要、CORSIA、国内コンプライアンス制度、第6条の4つの要素を検討。
これらの予測は3つのダッシュボードタブで確認できます。
1.シナリオの概要では、プロジェクトの種類、地域、需要源ごとに分割された年間需給グラフが表示され、低需要、中需要、高需要の3つのデフォルトシナリオのいずれかに初期設定されています。
2.プロジェクトタイプ」タブでは、シナリオ比較機能による詳細な分析が可能です。ユーザーはプロジェクトの種類を選択し、オプションで地域を絞り込むことができます。チャートは、シナリオ間のスポット価格範囲、供給元別の需要予測、地域別の年間発行量、累積未消化在庫を表すクレジット在庫を表示します。
3.ユーザーガイド」タブでは、ダウンロード可能な需要と供給の仮定を含む完全なモデリングアプローチを文書化しています。ユーザーは、自主的な需要予測、個々の遵守スキームの内訳、航空会社ごとのCORSIA 分析、および第6条の仮定を駆動するグローバルな排出シナリオを調べることができます。
Sylveraマーケット・インテリジェンス
炭素市場に関する最も明確で実用的な見解を得ることができます。
スポット価格
自信を持って現在の市場価格をナビゲート
何千ものカーボンクレジット またがる包括的なリアルタイムの価格インテリジェンスにより、公正な市場価値を特定し、取引の意思決定を最適化します。
- ブローカー、トレーダー、取引所、Silveraのソーシング・プラットフォームを含む40以上の独立した情報源から30万件以上の取引が検証され、自動化された品質チェックにより毎日更新されます。
- プロジェクトに特化した価格見積もりを検証された精度で取得- 20,000ヴィンテージの8,000プロジェクトをカバーする機械学習モデルで、信頼レベルのラベルを使用し、2週間以上1ドル以内で90%の精度を実現します。
- 価格パターンとプレミアム要因の分析- プロジェクトタイプ、地域、格付け、手法、コンプライアンス適格性による集計統計をフィルタリングし、どのような属性がより高い価格をもたらすかを理解します。
引取価格
市場情報に基づいた価格設定による先渡供給の確保
カーボンクレジット 契約の最も包括的なデータベースを使用して、フォワード契約をベンチマークし、戦略的カウンターパーティを特定します。
- フォワード市場で最大の取引を追跡- 2025年までの2億トン以上をカバーする200の個別オフテイクを、公開された取引をほぼ100%カバーし、隔週で更新
- 価格帯を可視化し、類似案件を特定- プロジェクトタイプ、場所、サプライヤー、購入者、発表日によるフィルタリングで案件レベルの粒度を示すインタラクティブなバブルチャート
- 買い手と売り手のマップ- マイクロソフトのような主要な市場参加者をドリルダウンし、数量、プロジェクトタイプ、サプライヤー、四半期ごとのトレンド、CDRの計画容量など、締結されたすべてのオフテイクを確認できます。
市場予測
シナリオベースの価格予測で戦略的な計画を
業界初のカーボンクレジット 市場向けエージェントベースモデルを使用して、十分な情報に基づいた長期的な投資と調達の意思決定を行います。
- 複雑な市場ダイナミクスをかつてない精度でモデル化- 20,000件以上のプロジェクトを、自主規制、CORSIA、国内コンプライアンス、および第6条の需要セグメントにわたって相互作用する個々のエージェントとして表現し、現実の市場の相互連関を把握します。
- 2035年までのプロジェクトタイプ別、地域別の価格帯(中央値、上限値、下限値)、供給予測、需要予測を示した低需要、中需要、高需要シナリオの分析。
- 前提条件を理解し、分析をカスタマイズ- ダウンロード可能な需給前提条件、発行内訳(既存プロジェクト、発行前 、将来の供給シミュレーション)、限界費用曲線を含む透明性の高い方法論文書にアクセスできます。
包括的なマーケットインテリジェンススイートの デモをリクエストしてください。