Turn carbon intensity into commercial advantage
Standardized carbon intensity, supply, demand and market insights for hydrogen, ammonia, cement, and beyond
Unlock value from carbon-differentiated commodities
Review carbon intensity. Identify which schemes your products qualify for and potential value. Track supply, offtakes, and opportunity across commodities.
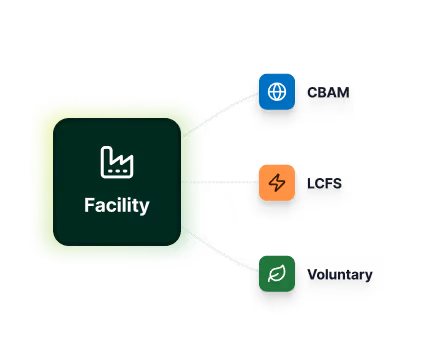
Carbon intensity
Standardized, facility-level carbon intensity calculations aligned to CBAM, EU ETS, and other major schemes. Benchmark against the market.
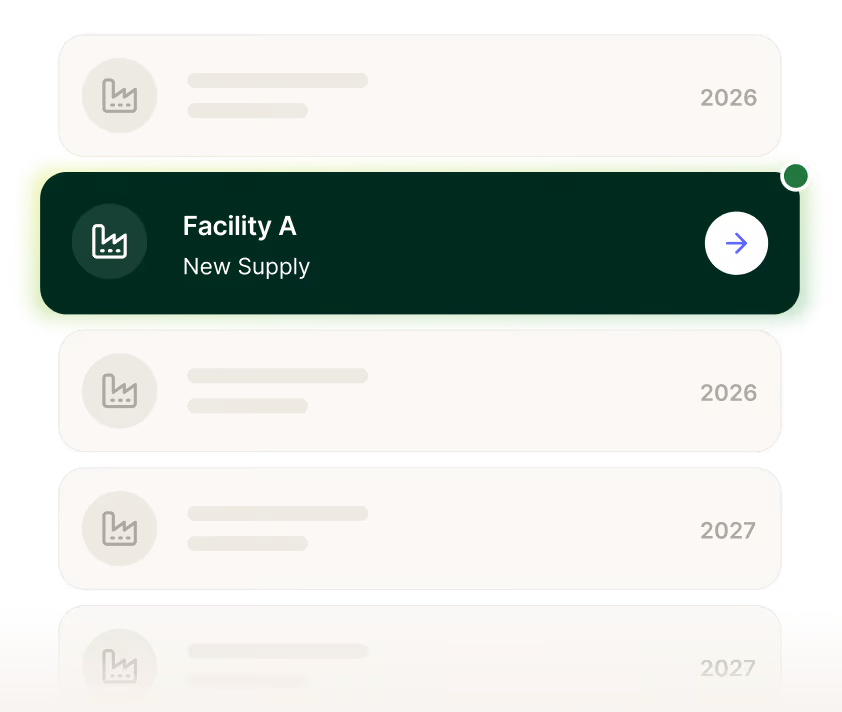
Upcoming supply
Visibility into planned facilities and their capacity, so you can track emerging supply and spot opportunities before the market catches up.
Market intelligence
Supply and demand tracking, pricing signals, and offtake visibility across green hydrogen, ammonia, cement, steel, and more.

What sets Sylvera apart
Typical commodity data

Prove, compare and commercialize low-carbon supply
Multi-framework carbon intensity
Calculate facility-level CI aligned to CBAM, LCFS, and other compliance and voluntary schemes. One data input, clear data output
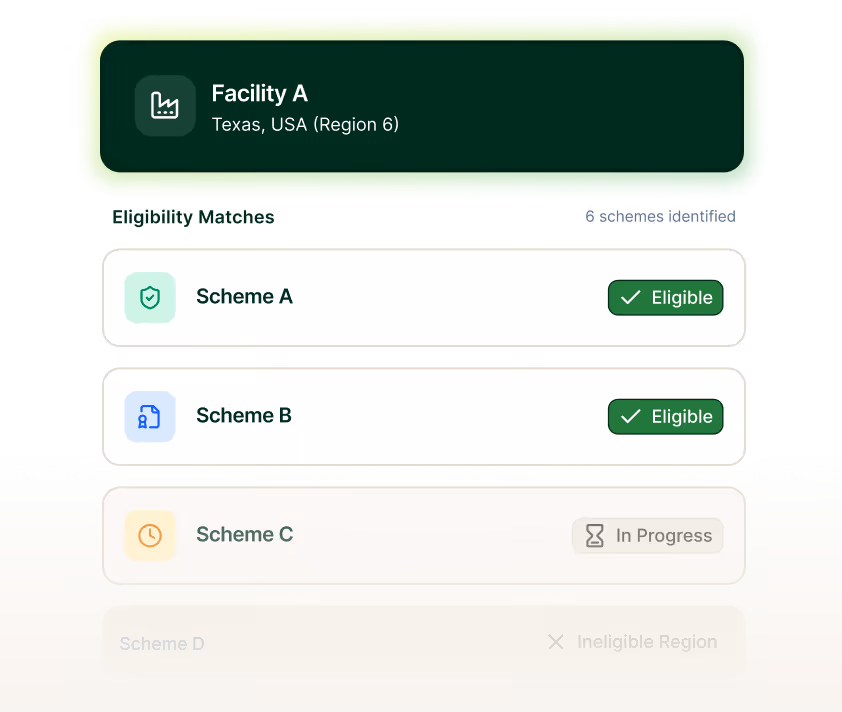
Mechanism eligibility mapping
See exactly which schemes each facility or cargo qualifies for-from regulatory compliance to voluntary certification - with estimated value.
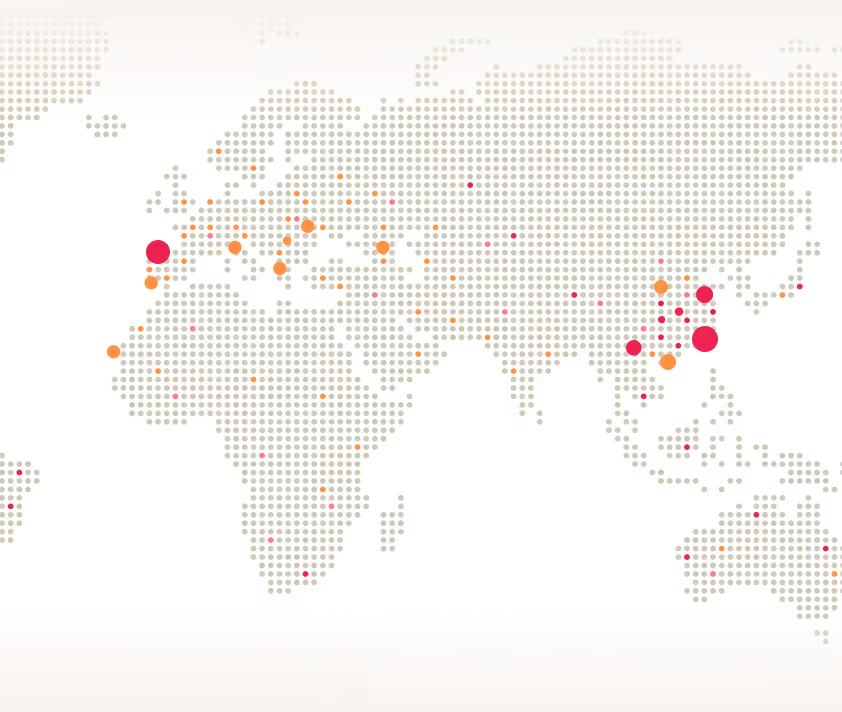
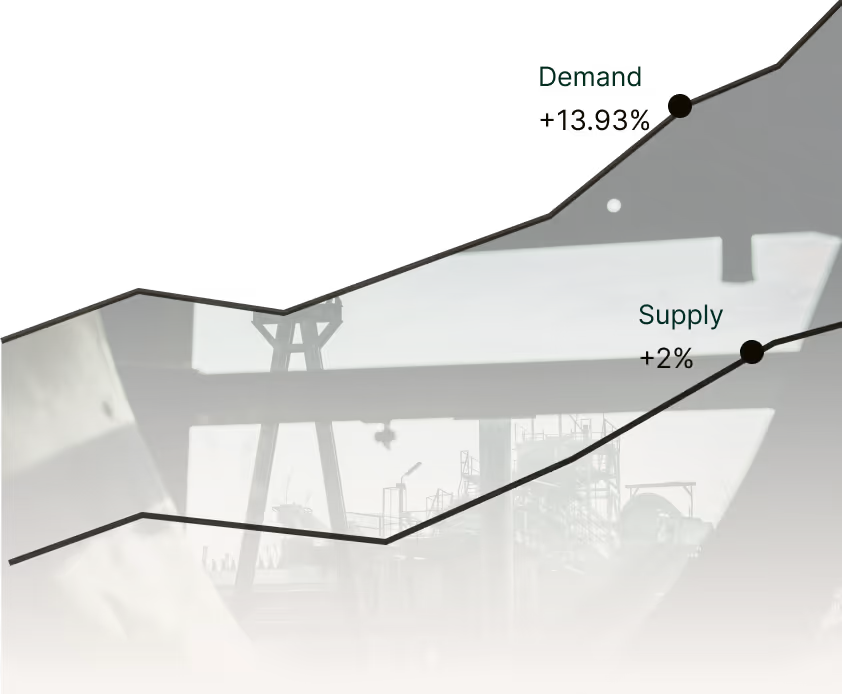
Market supply and demand
Track announced projects, production capacity, and offtake agreements. Identify where supply is emerging and where demand is strongest.
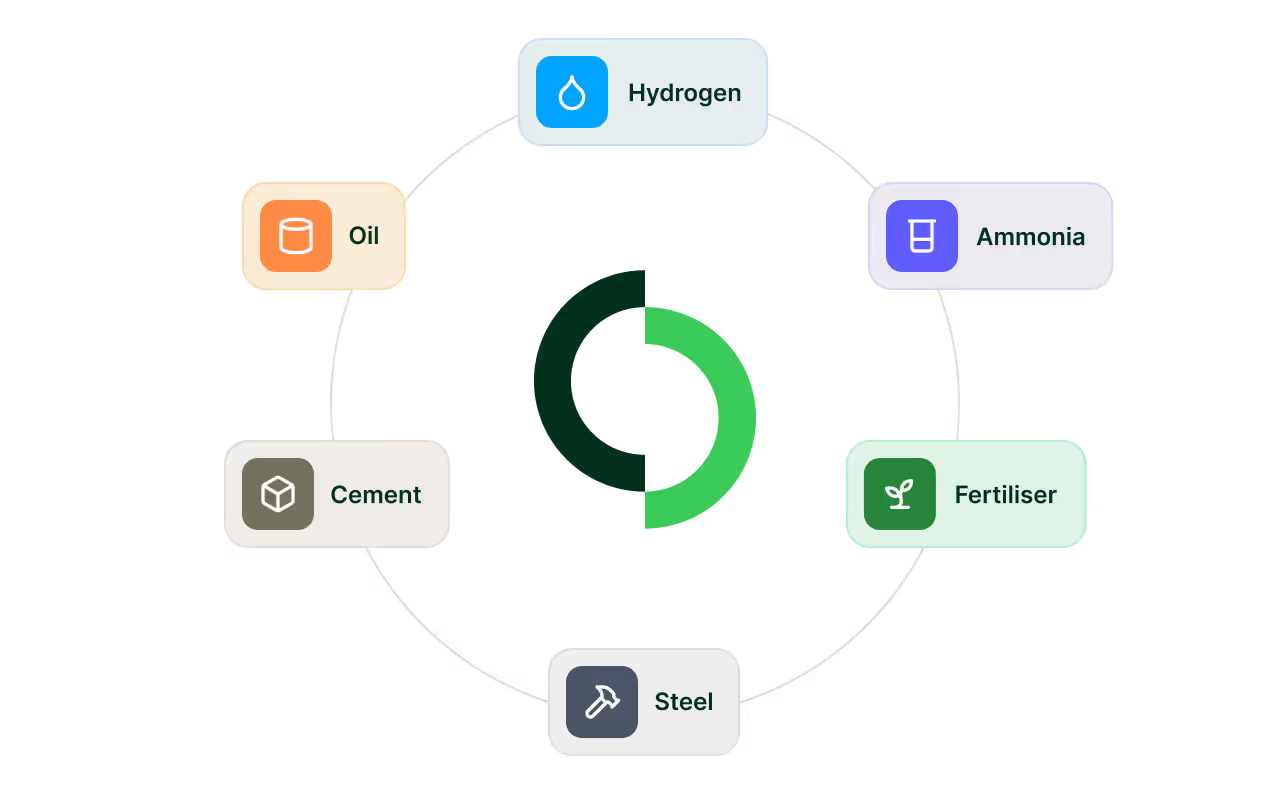
Cross-commodity coverage
Hydrogen, ammonia, fertiliser, steel, cement, and oil-managed in one platform
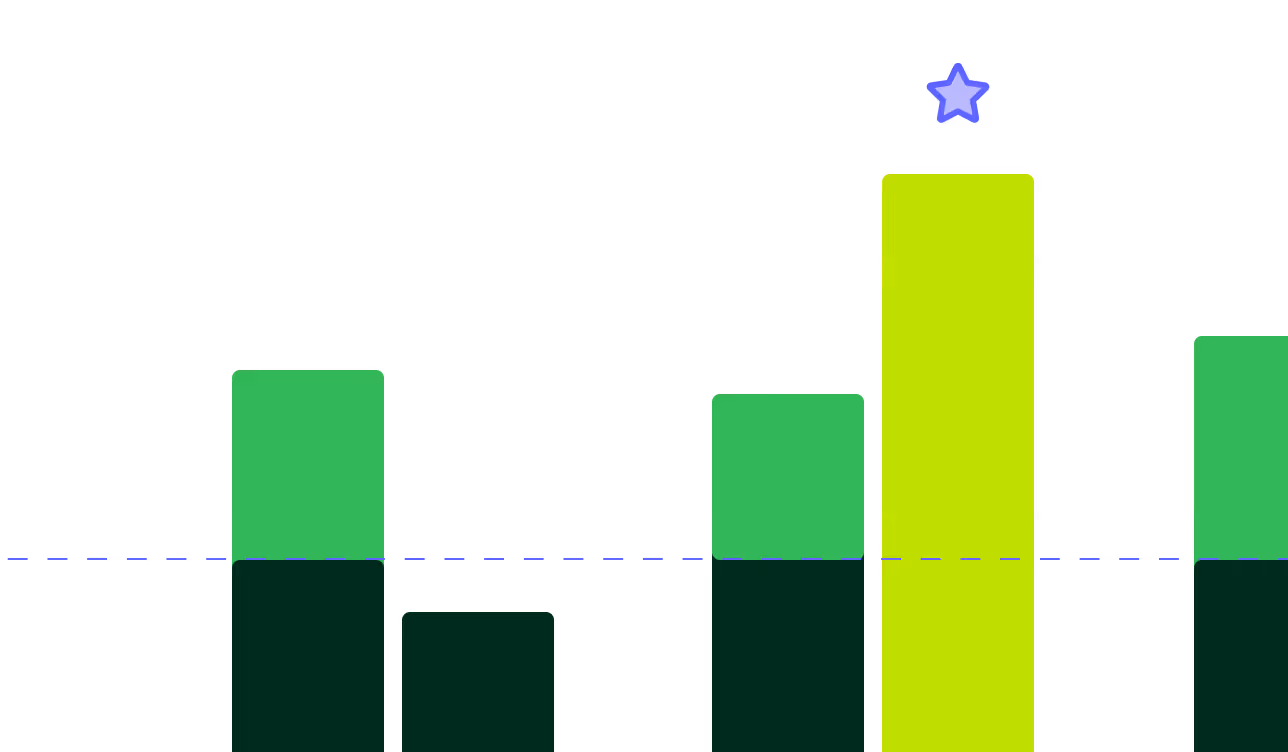
Benchmarking and comparison
Position facilities against peers in the market and top performers. Identify where to improve and where you already lead.
The same rigor you can trust
Sylvera already sets the benchmark for carbon credit quality. Commodity Insights extends that rigor to the physical commodities driving decarbonisation - applying the same independent, science-led approach to hydrogen, ammonia, steel, and cement. We collaborate with leading academics, governments, and multilateral institutions to advance carbon measurement. No conflicts of interest. No pay-to-play. Just trusted data.
FAQs
Carbon intensity measures the greenhouse gas emissions per unit of production - allowing buyers, investors, and regulators to compare facilities on a standardised basis.
As carbon border mechanisms like CBAM take effect and buyers face pressure to decarbonise supply chains, carbon intensity has become the primary metric for differentiating commodities. Lower-intensity production can unlock price premiums, regulatory compliance, and access to offtake agreements that standard production cannot.
Commodity Insights currently covers hydrogen, ammonia, and cement - with consistent methodology across all of them - plus global offtake tracking.
These commodities represent major sources of industrial emissions and are at the centre of decarbonisation policy. By covering them in one platform alongside offtake data, users can compare carbon performance, track market activity, and identify where low-carbon supply is emerging and where demand is strongest.
Sylvera calculates facility-level carbon intensity aligned to major regulatory frameworks including CBAM, LCFS, and RED III.
Rather than relying on generic emission factors, we use facility-specific data to generate standardised outputs compliant with multiple frameworks from a single data input. This means developers can prove compliance across jurisdictions, and buyers can compare facilities using the same methodology - regardless of where production is located.
Mechanism eligibility shows which regulatory schemes, compliance markets, and certification standards a facility qualifies for - along with estimated value potential.
Eligibility depends on carbon intensity thresholds, production methods, and regional requirements that vary by scheme. Sylvera automates this mapping so users can see exactly which pathways are available - whether that's CBAM compliance, clean hydrogen certification, or access to premium offtake markets - and model the financial value of each.
Sylvera Ratings assess the quality of carbon credits from offset projects. Commodity Insights evaluates the carbon intensity of physical commodities and their eligibility for regulatory mechanisms.
Both products apply the same independent, science-led approach, but they serve different parts of the decarbonisation landscape. Ratings help buyers avoid low-quality offsets; Commodity Insights helps producers, investors, and buyers navigate carbon-differentiated physical supply chains. Some users rely on both to manage emissions across Scope 1, 2, and 3.
Commodity Insights serves developers proving carbon performance, investors conducting due diligence, and corporate buyers comparing supply options.
Developers use it to attract offtakers and demonstrate eligibility for premium markets. Investors use it to assess facility-level carbon risk and ROI potential across mechanisms. Buyers use it to defend procurement decisions with standardised metrics and track delivery risk across offtake agreements.
Talk to us
Can't find what you're looking for? Talk to us about specific commodity market data requirements and see how we can help